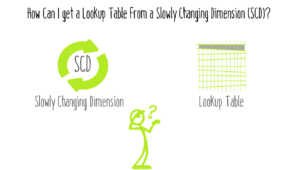
How Can I get a Lookup Table from a Slowly Changing Dimension (SCD)?
Your Power BI model is fed by a data warehouse, and you’d like to make some reports, but now your Customer table has several entries for each customer instead of one.
Your Power BI model is fed by a data warehouse, and you’d like to make some reports, but now your Customer table has several entries for each customer instead of one.
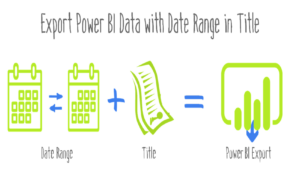
In Power BI, every visual needs a title. Titles not only makes it easier to manage items in the selection pane, but also provide context when exporting data. Without a […]
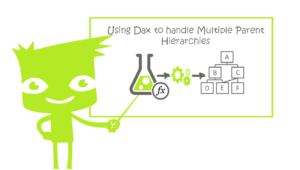
A common accounting task is to consolidate the financial results of subsidiary companies into combined results of a parent company. A parent company can have one or multiple subsidiaries.

How often do you think about quality checking your reports? Sounds about as fun as listening to a lecture from Ferris Bueller’s professor, right?

Not long after I started my career in FP&A, I became interested in KPI development. It’s a natural progression I think: you get the budgeting, forecasting, and reporting under control, and then you begin to dig a little deeper.

Think back to the year 2012 when Microsoft introduced us to SQL Server Analysis Services Tabular models.

Lord of the Rings. Mad Max. Star Wars. Indiana Jones… The Great Function Project.

As a Traditional Excel User, I could not stop copying and pasting downloaded reports. Even when my manager diagnosed me with inaccurate month-end reporting, I could not stop using external workbook links

It’s time again for the March Madness tournament and another excellent opportunity to introduce/teach people at your company/organization about Power BI.

P3 Adaptive has tried many different flavors of our brand of “consulting” through the years, but co-development projects that combine real projects with coaching and knowledge transfer have turned out to have been the sweet spot in terms of success.
Hello P3 Adaptive Nation, I’m excited to be back and writing a technical post again…it’s been too LONG!

Trailing twelve months (TTM) Power BI. Show each month and total trailing twelve months (TTM), the total for prior TTM, AND the variance in one table.