
It’s time again for the March Madness tournament and another excellent opportunity to introduce/teach people at your company/organization about Power BI. This article explains one approach for doing March Madness Power BI style, and using everyone’s bracket data to teach critical concepts on queries (unpivot, index columns, etc.), relationships, calculated columns, basic/advanced DAX measures, and visualizations. Of course, there are many websites on which you can run your March Madness tourney, but those don’t help your company/organization learn these powerful tools.
There are many Excel brackets you can find online each year, but the one used here is just a bracket format that uses Data Validation to set the pull-down list options to select the winner of each game based on previous round selections. It also has a hidden column to indicate which of the rows in the Round 2 Column are the result of a user selection (those cells with data validation), so that the rest of the Round 1 teams can be filtered out in the query. There are 67 choices each person makes (4 Round 1 Games, 32 Round 2 Games, Sweet 16, Elite 8, Final 4, 2 in the Championship, and 1 Champion). Each choice by each person becomes a row in our data model later.
Note: this example is using data from the 2017 tournament.
Once you have all the brackets from people, along with an empty bracket that will be used to enter the actual winner of each game as the results come in (name that file “Results”), you are ready to use this approach/data model (March Madness). There are three tables in the model, and each is described below with a summary of the query transformations used.
Building the Queries
Points – This table just gives the points earned for each correct choice, based on the round of the game. This data can be input with Enter Data in Power BI or pulled from an Excel spreadsheet. No additional transformation is needed, other than setting the Points column to Whole Number.

Results – This query turns the Results bracket file into a table that shows the winner of each game, keeps some useful fields like the Round for each game and creates an index column (GameID) which is used to form the relationship with the next table. You can see the actual query in the pbix file (in the linked zip file).
The main steps are:
- Filter out values that are not selections (i.e., teams not selected from Round 1 and Round 2 columns in the bracket file).
- Add an index column to be used for later sorting.
- Unpivot columns to get all choices into a single column.
- Do a two-column sort on round and index to get games in a consistent order.
- Add an index column and name it GameID.
- Split the team names by delimiter to get the “Seed” and “Winner” columns.
Below is a screen grab of some of the rows from this table.

Note: To demonstrate some of the forward-looking measures below, the Results file is populated in this article up to the Final Four teams (64 total rows vs. the expected 67).
Brackets – This set of queries and function is the result of Get Data from the folder containing all the submitted brackets. A custom function is created on the sample file exactly matching the one in the Results query so that the GameID columns match up. This function is then invoked for each file, resulting in a table with the 67 rows from each bracket. For this example, we used this fictional “Bunch” of employees (pun intended) that submitted brackets.
Note: Each filename is in the format of “Name_EmployeeID.”
Here is the Brackets query just after the Invoked Custom Function step:

Here is part of the final Brackets table:

Note: In the query, we also split the filename by delimiter to create an EmployeeID column, which can be used if other data are brought into the model as described in a previous post. For a large group, having a People table with organizational metadata is useful to allow people to filter to their department, group, building, function, etc. to see how they are doing against their cube mates.
Finishing the Data Model
Now that we have the three tables, it’s time for relationships, calculated columns, and measures. The relationships are shown below, with Brackets and Results connected through GameID and Brackets and Points connected through Round.

Three Calculated Columns were created on the Brackets table.
Note: All three could be handled as Measures, but this model was built for teaching and allows demonstration of calculated columns, and results in simpler Measures.
PossiblePoints =
RELATED ( Points[Points] )
Since this is a many to 1 relationship, Related() can be used to bring over the points possible for each round.
Correct =
IF (
RELATED ( Results[Winner] ) = BLANK (),
BLANK (),
IF ( Brackets[Winner] = RELATED ( Results[Winner] ), “Y”, “N” )
)
This one checks if there is a result populated for the GameID on that row and, if so, indicates whether there is a match or not.
Points =
IF ( Brackets[Correct] = “Y”, RELATED ( Points[Points] ), 0 )
This one just gives the points if correct.
There are a number of measures in the model, but here are a few of the simple ones, along with a couple more interesting/advanced ones.
Total Points =
SUM ( Brackets[Points] )
Pct Games Correct =
CALCULATE ( COUNTROWS ( Brackets ), Brackets[Correct] = “Y” )
/ COUNTROWS ( Brackets )
Rank Overall =
RANKX ( ALL ( Brackets[Name] ), [Total Points] )
Rank AllSelected =
RANKX ( ALLSELECTED ( Brackets[Name] ), [Total Points] )
On any March Madness dashboard, first and foremost, people want to know how they are doing and what their rank is. The above measures provide that for this model. Since each row in the Brackets table has a calculated column with the points earned with each correct choice, all we need to do is Sum() that column for Total Points. The next is a simple % of Total measure (games correct over total games). Two versions with the RANKX() function are given, in case there are slicers from other fields in play from these or other tables (e.g., Round, Department).
Running Total =
VAR RoundNum =
MAX ( Brackets[RoundNumber] )
RETURN
CALCULATE (
[Total Points],
ALLEXCEPT ( Brackets, Brackets[Name] ),
Brackets[RoundNumber] <= RoundNum
)
The above measure gives the total for the current and all previous rounds, to be used in a ribbon chart, for example, to see who was in the lead at which point.
Once someone sees they are not in first place, they’ll want to know two things:
- How many points can they still get?
- Did everyone else choose the same as me and will get the points too?
The second question is easier to answer with the measure below. It tells them how similar their remaining choices are to choices by everyone else (i.e., did others choose the same teams and will get the same points?). It is used in the file in a Matrix with Teams (Winner column) as the Rows and Round as the Columns with conditional formatting to show high overlap (bad/red) vs. low overlap (good/green).
Pct Overlap with Others =
DISTINCTCOUNT ( Brackets[Name] )
/ CALCULATE ( DISTINCTCOUNT ( Brackets[Name] ), ALLSELECTED ( Brackets[Winner] ) )
The first question is a lot trickier but can be answered with this measure below, which tells them what their max possible score could be given the choices they’ve made vs. the teams still left in the tourney.
The use of variables makes it easier to follow.
Max Possible Points =
//First find all the GameIDs for which there is no row in the Results table (not entered yet)
VAR RemainingGameNums =
EXCEPT ( VALUES ( Brackets[GameID] ), VALUES ( Results[GameID] ) )
//Then find the latest round for which results have been entered
VAR MaxRoundNum =
CALCULATE ( MAX ( Results[RoundNumber] ), ALL ( Results ) )
//Then make a table of the teams remaining in the tournament (those that have the MaxRoundNum)
VAR TeamsRemaining =
CALCULATETABLE (
VALUES ( Results[Winner] ),
ALL ( Results ),
Results[RoundNumber] = MaxRoundNum
)
//*Then iterate through the table of remaining games, compare to TeamsRemaining and if that team is still alive in the tourney, assume they got it right*//
VAR MaxRemaining =
SUMX (
RemainingGameNums,
CALCULATE (
IF (
COUNTROWS ( INTERSECT ( VALUES ( Brackets[Winner] ), TeamsRemaining ) ) = 1,
SUM ( Brackets[PossiblePoints] ),
0
)
)
)
//Then add the possible remaining points to the points they already have to get the max possible points
RETURN =
MaxRemaining + [Total Points]
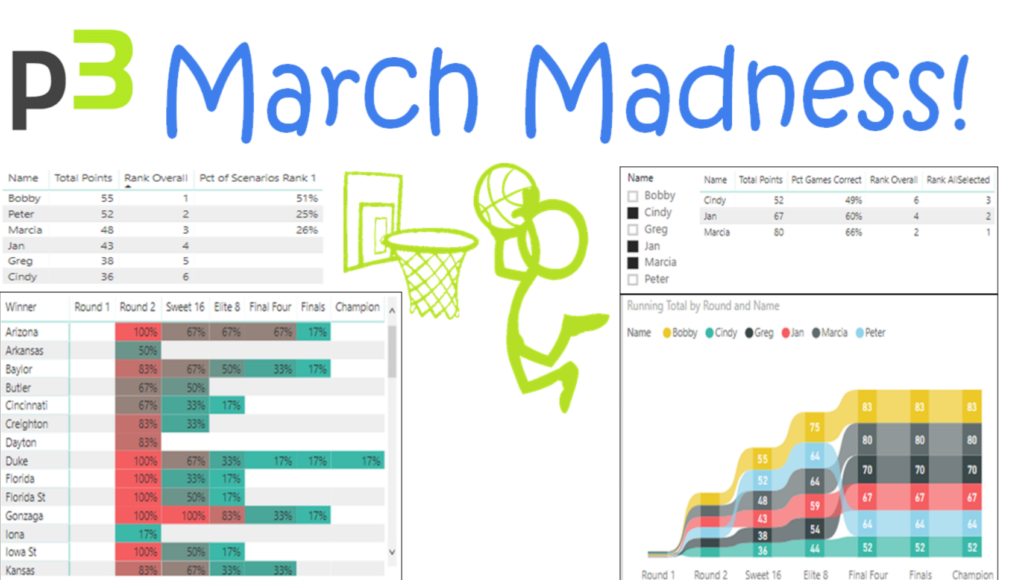
With all the measures in place, we can now create the visuals.
Below are screen grabs of the ones mentioned above.


This article talks about using this model for instruction; however, the last measure is a little more advanced. Since we are over that line, let’s keep going. While it is good to know what everyone’s max possible score is, what people want to know is, which scenarios will result in them winning the bracket competition. To write that measure, we first need to generate all the possible combinations.
Each game has two possible outcomes, and the whole bracket has over 9 X 10^18 possible combinations. Power BI can do many rows, but not that many. I decided to use Power Query/M to generate all the scenarios possible once the final 16 teams are decided (still 32,768 of them!).
You can see the full 64-step query in the file, but it begins with a reference to the Results query, filters to the list of teams in the Sweet 16, and systematically adds columns for each remaining game (Games 53 to 67). Each new column is a List of the two teams playing in that game, and the number of rows doubles when we “Expand to New Rows” for the List. Once we have the 32,768, an Index column is added so we can iterate through each scenario in our measure. This table is then unpivoted so we can also iterate through each game.. in each scenario… against each person’s picks in the Brackets table.
Here is what one of the steps from the query looks like, along with a few rows from the final Scenarios table. The unpivoted table for scenarios has 491,520 rows (32,768 scenarios X 15 games remaining after Sweet 16).


Since the Scenarios and the Brackets table have multiple values for each GameID, a Games table is added that has just a list of the GameIDs remaining after the Sweet 16. We use this to filter both the Brackets and Scenarios tables.
Now we write a couple of measures:
This one calculates the point for a given person for a given scenario added to the points earned from the completed games:
Scenario Points =
SUMX (
FILTER ( VALUES ( Games[GameID] ), Games[GameID] >= 53 ),
CALCULATE (
IF (
FIRSTNONBLANK ( Brackets[Winner], 1 ) = FIRSTNONBLANK ( Scenarios[Winner], 1 ),
AVERAGE ( Brackets[PossiblePoints] ),
0
)
)
)
+ [Total Points]
The above measure can be used in a scatter plot to visually assess which scenarios are best for each person. The user can click on a single point to filter a table below to show the game winners for that scenario.

And now for a measure that, for a given person, gives the percent of the possible scenarios in which they are ranked #1. The main part of the measure will be that table that gives the ranks for each Scenario for that one person.
Pct of Scenarios Rank 1 =
IF (
HASONEVALUE ( Brackets[Name] ),
COUNTROWS (
FILTER (
ADDCOLUMNS (
SUMMARIZE ( Scenarios, Scenarios[Scenario] ),
“Rank”, CALCULATE ( RANKX ( ALLSELECTED ( Brackets[Name] ), [Scenario Points] ) )
),
[Rank] = 1
)
)
/ DISTINCTCOUNT ( Scenarios[Scenario] )
)
There is a lot of processing going on, so it is not the most performant measure. However, now we put it in a table to show who has the best chance of winning it all.
Note: Before generating this table, the Results query was refreshed against a Results bracket populated to just the Sweet 16. This year, it looks like only Bobby, Peter, and Marcia have a chance to win it all.

I hope this article is useful to some, either to run their local March Madness tourney in the future or to teach others. It uses many of the key elements of queries, relationships, DAX, and visuals, and showcases the power and flexibility of both M and DAX.
Where It’s At: The Intersection of Biz, Human, and Tech*
We “give away” business-value-creating and escape-the-box-inspiring content like this article in part to show you that we’re not your average “tools” consulting firm. We’re sharp on the toolset for sure, but also on what makes businesses AND human beings “go.”
In three days’ time imagine what we can do for your bottom line. You should seriously consider finding out 🙂
* – unless, of course, you have two turntables and a microphone. We hear a lot of things are also located there.
Get in touch with a P3 team member