It is a standing joke in the analytics industry that “Export to Excel” is the most used feature of any analytics application. And while most analysts can attest that there is some truth in that, in all honesty, not all data exports to Excel are created equally. Some data exports are just mortifyingly messy and others deliver an unhealthy level of dread when the file is opened. Fortunately, Microsoft is improving that process for the Matrix Visual in Power BI by adding new options in the latest update.
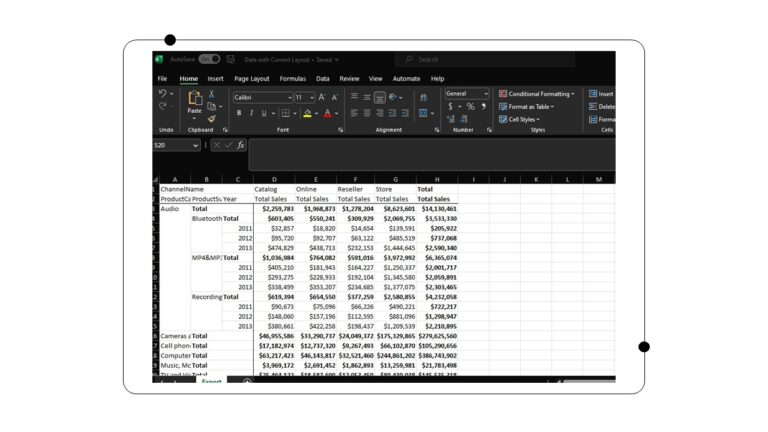
With the new, improved export options for table and matrix visuals, you can now seamlessly export your data in a way that’s both intuitive and user-friendly. And the best part? You don’t have to sacrifice formatting or grouped dimensions in the process!
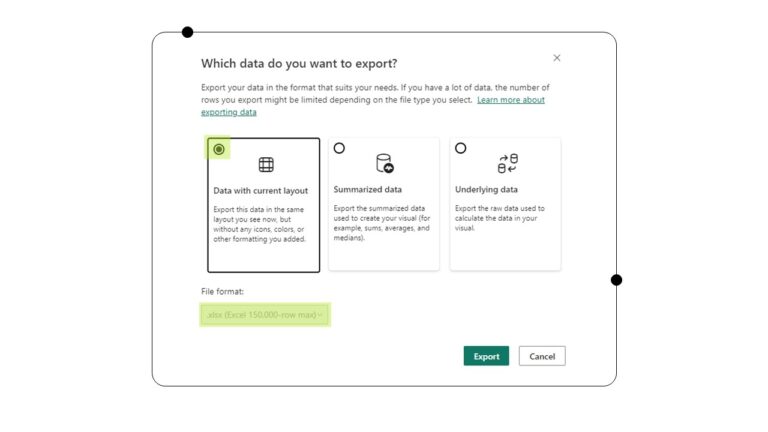
By exporting to Excel with the new “Data with current layout” option, your visual structure and formatting can be preserved. This option is available to users who don’t use time intelligence and are looking to create snapshots of tables or matrices for future comparisons. Additionally, this option is perfect for retaining dynamic format strings in calculation groups when exporting to Excel.

To use the new export to Excel function with a matrix in Power BI using the “Current layout” option, follow these steps:
- Select the matrix visual you want to export.
- Click on the “…” (ellipses) button on the top right corner of the visual to open the context menu.
- In the context menu, select “Export data”.
- Select “Excel (.xlsx)” as the export format.
- Choose “Current layout” as the data option. This will export the data as it is shown in the visual, including any formatting, subtotals, and grouping.
- Click on “Export” to start the export process.
- Power BI will generate an Excel file with the exported data. You can save the file to your local machine or open it directly in Excel.

Note: The “Current layout” option is now available in Power BI Desktop as of the latest update. If you’re using an older version or a different version of Power BI, this option may not be available.
Classic Options Still Exist
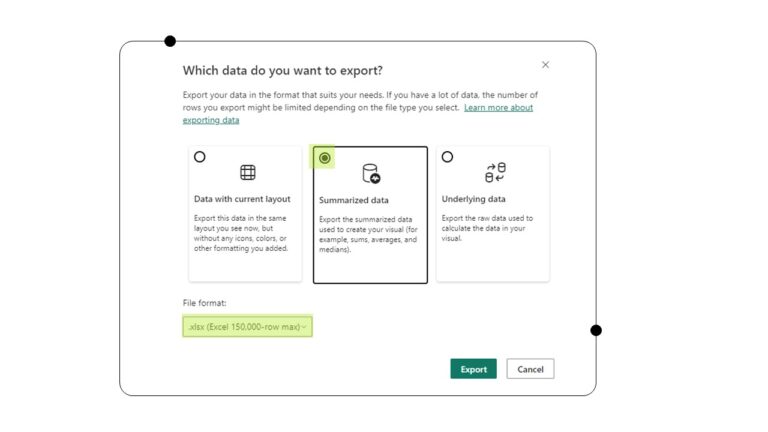
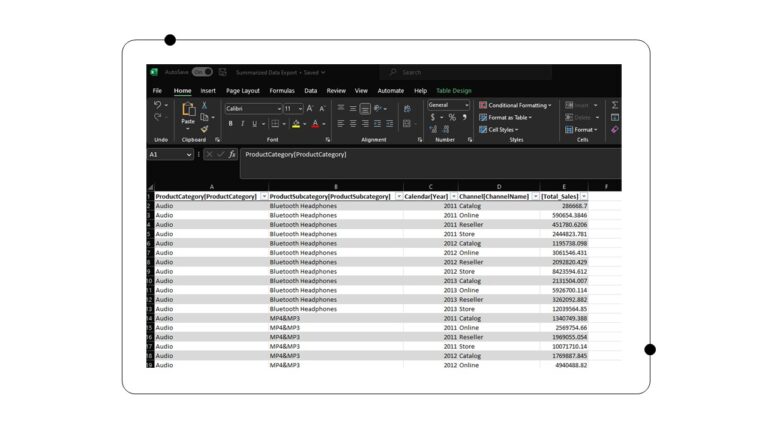
Don’t worry, though, Power BI’s “Summarized data” and “Underlying data” export options were not replaced and still provide you with a sleek, flat table of rows and columns. This original option is perfect for adding to your Power Pivot model, creating a PivotTable for analysis, or building your own Power BI dataset directly in Excel to share with others.

To use the export to Excel function in Power BI using the “Data with summarized data” option, you can follow these steps:
- Select the matrix visual you want to export.
- Click on the “…” (ellipses) button on the top right corner of the visual to open the context menu.
- In the context menu, select “Export data”.
- Select “Excel (.xlsx)” as the export format.
- Choose “Data with summarized data” as the data option. This will export the data along with any summarization and aggregation performed in the visual, such as totals and subtotals.
- Click on “Export” to start the export process.
- Power BI will generate an Excel file with the exported data. You can save the file to your local machine or open it directly in Excel.

Note: The “Data with summarized data” option is useful if you want to export the summarized data along with the raw data, or if you want to perform further analysis on the summarized data in Excel.
So, there you have it! This latest improvement to the export to Excel function in Power BI is a fantastic upgrade for anyone who loves working with data. It’s easy to use and has different options to help you get the data you need in the format you want. Check out the new export options and see if they bring new life to exported data.
While exporting data to Excel is a good starting point for basic analytics, it often falls short of delivering the level of insights that businesses need to make informed decisions. If you’re looking to gain deeper insights into your data and leverage advanced analytics capabilities such as time intelligence, then our team of Power Platform experts can help. Contact us today to learn how our team of experts can help you harness the power of advanced analytics and gain deeper insights into your business. We turn your data into a competitive advantage.
Get in touch with a P3 team member