How often do you think about quality checking your reports? Sounds about as fun as listening to a lecture from Ferris Bueller’s professor, right?
Why Test?
Quality testing is one of those things that few of us enjoy but is vital to maintaining the trust of people who consume our reports. One of my former bosses, who was a former McKinsey consulting that I worked with during my MBA internship, taught me many valuable lessons about Excel and financial modeling. One that stuck out in my mind was “always include controls in your spreadsheets. It gives your readers the peace of mind that you’ve thought about all of the ways the model could break.”
That’s excellent advice and a recommendation that becomes especially important when you use an agile, self-service, BI development process. When we work with clients, they are often wowed by our initial proof of concept, but then quickly get used to the new level of insights they’ve achieved and begin to ask new questions! “Wow, if seasonally-adjusted average daily sales dropped in March, did we fairly allocate sales to our sales reps?” Rob likes to call this the virtuous cycle of questions (see #7) whereby new visibility achieved by an awesome dashboard leads to new questions.
This is the goal of a successful dashboard but also requires careful attention that each time you iterate a model, you don’t break previous calculations.
One way to approach this would be to manually test your new dashboard against the previous version and validate that key metrics are calculating as expected. Each time you release a new version, you’d check some key figures yourself … this is what most people do. But as you’ve guessed from the title of this post, we’re going to examine a supercharged way to automate this process.
Setting up your tests
The basics of automated testing are simple. We manually test a measure in a representative filter context and then write “validated” test cases based on the result. For example, “[Sales $] is supposed to equal $150,000 for August 2018” is a test case that you might have confirmed manually by running the calculation on the raw data. More generally, if we feed input X into the model, it should output Y.
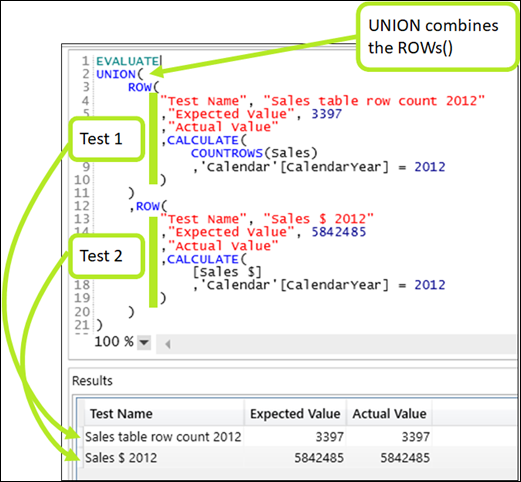
To make this more concrete, let’s take an example. Using the AdventureWorks dataset, I created a basic Power BI Model. Let’s assume that we have validated a few measures, specifically we know that in 2012, the company sold $5,842,485 over 3,397 transactions. I will use these two test cases to explain how to automate testing.
If you’d like to follow along in the real PBIX file, please download this zip file here and extract it to a single folder. Then open the PowerQuery editor and change the “Path” parameter to the folder where you extracted the files.
Setting up DAX Studio
The most reliable way I’ve found to automate test cases is to write a testing script in DAX Studio. Let’s start by downloading the tool.
Once you have it up and running, you can connect to your open Power BI model.
After we’ve connected, we should see a blank query editor. If you’ve ever worked with Microsoft SQL Server, this should be a familiar view.
Let’s start with a basic formula:
EVALUATE
Sales
DAX Studio queries generally start with EVALUATE and are followed by a formula that must return a table. In the formula above we are asking DAX Studio to return the entire Sales table, which we see in the result set below the formula.
What if we want to return a measure?
EVALUATE
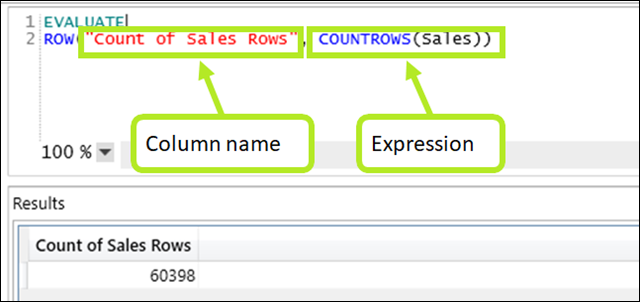
ROW("Count of Sales Rows", COUNTROWS(Sales))
Here we’re using the ROW function to return a single row with any number of columns. We have to define each column name followed by a measure or expression. Since ROW() technically returns a table, we’re golden, and DAX Studio can execute the query.
Finally, add some filter context to the ROW() function to simulate the test case we created initially.
EVALUATE
ROW(

"Count of Sales Rows"
,CALCULATE(
COUNTROWS(Sales)
,'Calendar'[CalendarYear] = 2012
)
)
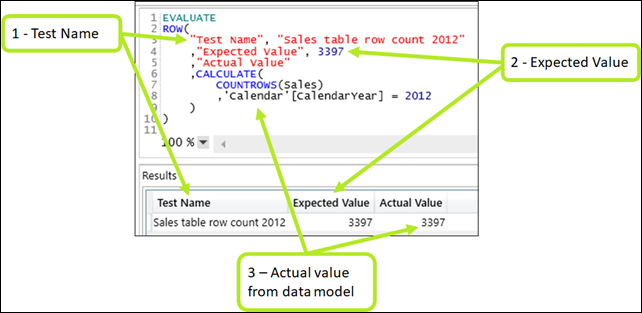
By wrapping the expression in CALCULATE, we can simulate a specific result from Power BI. In this case, we are calculating the number of sales rows in 2012, successfully matching the value that appears for the same year in the report.
Building an Automated Test
We now have several pieces of information: syntax for writing queries in DAX Studio as well as a test case. Let’s put the pieces together into an automated test case.
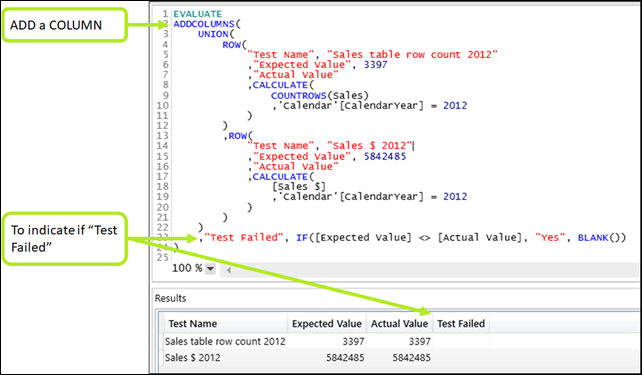
First, we add two columns to the ROW() function: one with our test name (for reference) and one with our manually-validated hardcoded result that we’d expect from that measure in that filter context.
To combine multiple tests into a single query, use UNION():
And finally, to highlight tests that failed, use ADDCOLUMN’s with a bit of logic:
There you have it, our first automated tests. Now, whenever you’d like to, you can run that script on your data model and instantly detect if any changes you made screwed things up and are returning the wrong results!
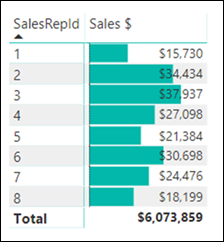
Let’s try it to show you what I mean. Let’s augment my sales table by merging in a SalesRepID for each SalesOrder#. To do this, we’ll create a new query that loads data from the “SalesOrderRepId” sheet in the “Automated Testing Source Data.xlsx” workbook. Then, let’s merge that into the Sales table by matching rows using the SalesOrderNumber column, as seen below.
Looking at our report, we can now build a pivot table with our new SalesRepId. Looks good!
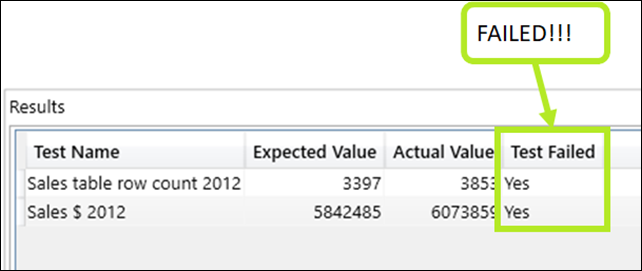
However, now that we have an automated testing script, we can quickly check whether anything has broken. Let’s re-run the script after having made this change to the data model.
A seemingly innocuous change like merging in a new column of data can sometimes have unintended consequences. In this case, certain SalesOrderNumbers have multiple SalesReps, and therefore PQ duplicated rows in the Sales table. You might easily catch this on a simple report, but on complex reports with significant business logic, it becomes harder to spot these discrepancies. This approach to automated testing has saved me hours of manual testing with real reports and helped me detect errors that otherwise weren’t obvious at first glance.
Wrapping it up
Automated tests such as these will not guarantee that you’ll catch all possible errors. However, they act as an easy first line of defense against deploying buggy releases of your new dashboards.
To close, here are my top tips when writing automated tests.
- I like to focus on the most complex measures, the ones with lots of changing filter context as these are most likely to break inadvertently. Also, focus on the last measures in your measure tree as opposed to your base measures (i.e. [Sales $ Last Year] is based on [Sales $] so you’d focus your tests on the former.
- Get in the habit of writing these tests as soon as you manually validate a measure.
- When you come across calculation errors down the road that you didn’t anticipate, get in the habit of quickly adding those new test cases to your automated scripts. Work once, reap the benefits forever.
Did you find this article easier to understand than the average “tech” article?
We like to think that is no accident. We’re different. First of a new breed – the kind who can speak tech, biz, and human all at the same time.
Want this kind of readily-absorbable, human-oriented Power BI instruction for your team? Hire us for a private training at your facility, OR attend one of our public workshops!
