Category: Creative Visualizations
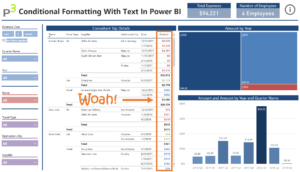
This is one of those things where I spent a lot of time figuring out how to do something non-obvious. And hey, that’s usually a good thing to share! Keeps others from burning needless time, pushes the envelope a bit, inspires “riffs” and improvements on the core idea, etc.
Written by Rob Collie on October 23, 2019
Five years on from my life-changing encounter with PowerPivot, my pilgrimage to the Nirvana of Modern Excel continues with some occasional detours.
Written by Sakiko Stickley on August 7, 2018
Hello P3 Adaptive Nation! Today’s “post” is going to be a video link. Sometimes there are certain subjects, concepts, or post ideas that just don’t translate well to the written word, and especially to screenshots.
Written by Reid Havens on July 20, 2018
Hello P3 Adaptive Nation! Today’s “post” is actually going to be a video link. Sometimes there are certain subjects, concepts, or post ideas that just don’t translate well to the written word, and especially to screenshots
Written by Reid Havens on June 21, 2018
How to Create A Real Time Dataset on Power BI.com
Written by Reid Havens on May 1, 2018
It’s time again for the March Madness tournament and another excellent opportunity to introduce/teach people at your company/organization about Power BI.
Written by Patrick Mahoney on March 18, 2018
A long time ago a peer in Financial Planning and Analysis said “Financial Planning starts in the home.” I modified the statement to “Data analytics starts in the home.”
Written by Denton Chase on February 13, 2018
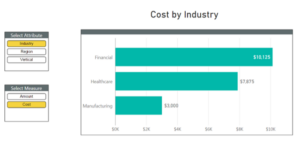
Dynamic attributes and how to implement them in Power BI Desktop or Power Pivot using “Harvester” measures and disconnected slicers.
Written by Brad Elsmore on January 2, 2018
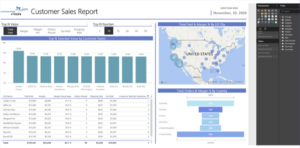
I’d like to drop some reporting knowledge. I’m going to share some of my best practices for Power BI Reporting I’ve developed over the years
Written by Reid Havens on June 6, 2017
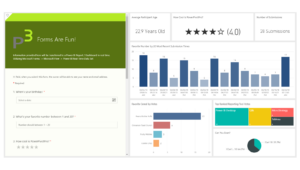
First off…my first post! Being one of the newest (and youngest) members of the P3 Adaptive family has been very exciting so far. As a way of introducing myself, I’d like to share a creative solution to a problem I’m sure many of you have encountered when building a report or dashboard.
Written by Reid Havens on May 9, 2017
This automatic BI tool has saved me innumerable hours each month and I find this useful for at least 80% of my DAX formulas.
Written by Reid Havens on April 20, 2017