
Journey to P3 Adaptive : Reid Havens
Buckle in folks, this is going to be a long and engaging article. As we enter 2018, I realized that I’m approaching the one-year anniversary of my first blog post here at P3 Adaptive !
Buckle in folks, this is going to be a long and engaging article. As we enter 2018, I realized that I’m approaching the one-year anniversary of my first blog post here at P3 Adaptive !
Hello P3 Adaptive World! My name is Krissy Dyess and I have had the most amazing experience working as a full-time consultant at Power Pivot Pro since April 17, 2017!

Every month Power BI gets an update that adds a nice handful of new features. Let’s read about this month’s awesome feature…Bookmarks.
Dynamic attributes and how to implement them in Power BI Desktop or Power Pivot using “Harvester” measures and disconnected slicers.
I tried solving this problem and the internet led me to SUMMARIZE(). It was stuffed inside another function and it confused me
My new seminar’s mission is to provide business leaders with easy-to-follow recipes for data-driven success

Welcome to the latest P3 Adaptive Coffee Talk, where members of the community discuss various topics related to Power BI, Power Pivot, and Analytics/BI in general.

When working with clients or students, I like to challenge them with this seemingly-controversial statement: Informing people is worthless.

We recently received some very sad news: the world lost Mike Miskell, one of the absolute-best humans I’ve ever met, a little over a week ago.

Over the summer P3 Adaptive achieved our Microsoft Partner Gold Competency in Data Analytics. As part of our increasing focus on our partnership with Microsoft we invited Tamer Farag, the Global Partner Ecosystem Lead for Power BI, PowerApps and Microsoft Flow at Microsoft, to participate in our latest coffee talk. Below is a transcript of a Slack conversation held 8/30/2017, edited for clarity and brevity.
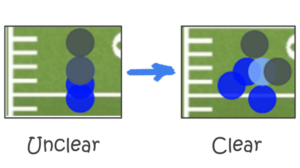
In a recent post, I hinted that I’d be using the Football Project V2 as my “platform” for some future techniques-oriented posts. T

Welcome back P3 Adaptive Nation! By now we’re in full swing with this Power Query (M)agic series, three posts and counting!