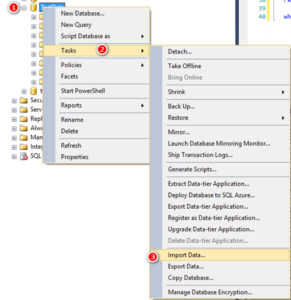
Power Query as an SSIS Alternative
One of the many things I love about Power Pivot and Power Query is that these tools have put BI into the hands of users
One of the many things I love about Power Pivot and Power Query is that these tools have put BI into the hands of users

Guest Post by Andrew Todd Cube Formulas: Ultimate flexibility for your reports but lots of drama to update… A while back, I was tasked with finding a way to automate […]
An article on the Power BI Desktop New Feature by the experts at P3 Adaptive .
We’ll be hosting our monthly “Excel to Power BI” Webinar on Aug 18. Short notice, I know. But that means you have no excuse to dally, register today! Invite your colleagues, friends, even your mum.
An article on how to transition from Excel Power Pivot or Power Query to Power BI Desktop from the experts at P3 Adaptive .
I was helping a friend out recently with an interesting problem. It all started with a SUM( ) that wasn’t behaving.
Yes, you know that pivots are meant to show aggregations. Summaries.
In our last webinar the #1 question and confusion seemed to be around Excel versus Power BI Desktop (formerly called Power BI Designer). The thing is, both tools are really part of an ecosystem. And the biggest confusion was around understanding how these tools fit into the overall landscape.
This post is based on a query that I got in our monthly Q&A session held for our Online Class attendees.
The more I use Power Query, the more I want to use Power Query – and of course the more I learn.
This is Power BI Designer, a New Product from Microsoft, and It’s Relevant to ALL of Us.
By Avi Singh [Twitter] If you want to look for trends based on weekday (Sunday…Saturday) or month-of-the-year seasonality (January…December), Cycle Plots can be a potent visualization tool.