
Manufacturing KPI Dashboard
A manufacturing performance dashboard is a digital interface that consolidates data from various facets of your manufacturing operations.
A manufacturing performance dashboard is a digital interface that consolidates data from various facets of your manufacturing operations.

If you are looking to transcend the limitations of Excel, Power BI is a potent alternative with its enhanced data visualization capabilities

Supply chain analysis is an essential tool that enables business leaders to evaluate every aspect of their operational processes

Power BI is a business analytics service by Microsoft focused on providing interactive visualizations and business intelligence capabilities

Are you ready for some data football? Rob Collie kicks things off with a Power Query puzzle that’s as messy as an interception in the end zone. On the other […]

Recently, we hosted Allision Kennedy on the Raw Data by P3 Adaptive Podcast. During the course of the conversation
Lists in Power Query are something many people know nothing about. Power Query uses them all the time even though you may not realize it, so if you add some List knowledge to your quiver, you’ll be able to kick your Power Query skills up a notch.
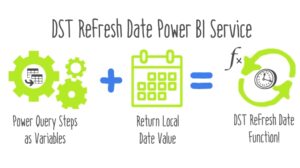
Quick tip for DST Refresh Date function Power BI Service. I’ll put the code up front, and explain it below.

Happy Thanksgiving everyone! Normally I use this holiday as an excuse to post something off-topic, but this year, I’m gonna stay ON topic and share something I’ve been meaning to broadcast for awhile. I just haven’t had the time to catch my breath.

I loved Nar’s post on Automated Testing using DAX. I especially like the rule of always including controls so that business readers can share responsibility for data quality.
Well, it’s been a while since I’ve blogged – what can I say, it was a busy summer! BOO you say?! You need your Cat Meme fix!?! Well, let’s see if I can DO something about that!
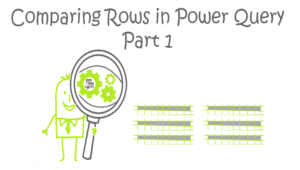
It is straightforward to compare values between each row in an Excel table and the next row.