It is straightforward to compare values between each row in an Excel table and the next row.
You can create a calculated column in a table and reference values in other columns in the same row by name and cells in different rows by using regular referencing. Such a reference is fragile. Sorting or deleting rows will break the formula or return bogus results. You need to replace the formulas by values, and at this moment it cannot be refreshed and recalculated automatically. By using Power Query (aka Get & Transform), I can calculate the difference between one row and the previous row in a robust and refreshable way, albeit not as easy as a simple Excel formula.
Task on-hand
I want to analyze the daily prices of certain commodities and be able to show the patterns of daily changes side by side. I want to calculate predictably the differences between each row and the row before. Each row represents data for a day, so the difference between rows is the daily change or in some cases, several days change.
I downloaded from Quandl 50 years of daily prices of gold and silver, and my goal is to calculate the daily changes in terms of dollars and percentage from day to day. Not all days are represented, so in case of a gap I calculate the number of days in the gap, and I divide the growth % by the number of days. I already imported and appended the data for both metals into a single table in Excel and we’ll start the process from this table.
Step by Step data Preparation
You can download the zip file with the .xlsx and the .pbix to follow along from here.
I suggest that you start a new query from the Prices table and follow my instructions.
I reference the Prices table, and in the next step I filter out days in which the price is empty.
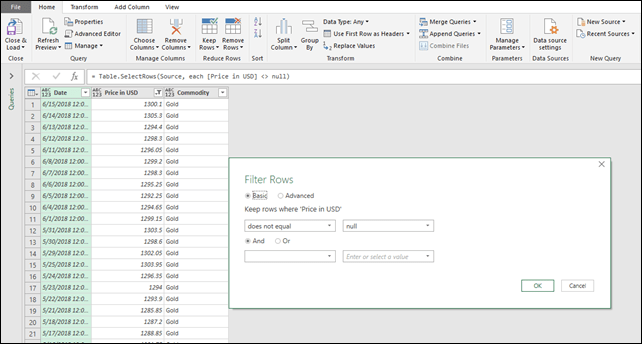
There is one such day, and it may skew the results.
I sort the rows in the table by the commodity and the date.

I don’t want to rely on any existing order and make sure that I get all the Gold prices by day and then the Silver prices.
At the next step, I add an index column starting from zero.
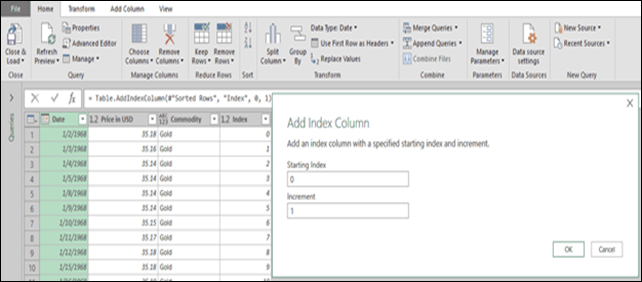
An index column is a way to fix the current order and will be used later for comparing row 0 with row 1, row 1 with row 2, etc.
I renamed the step of inserting the index column to Zero because I will later reference the table created in this step.
Each step in the query creates a new table, and I can refer to previous tables by name.
At this point, I insert a new custom step. I can do it from the Fx icon in the formula bar or the right-click menu in the step list. The new step by default references the table created in the previous step, but I change it to =#”Sorted Rows” which is the name of the table before adding the index column.

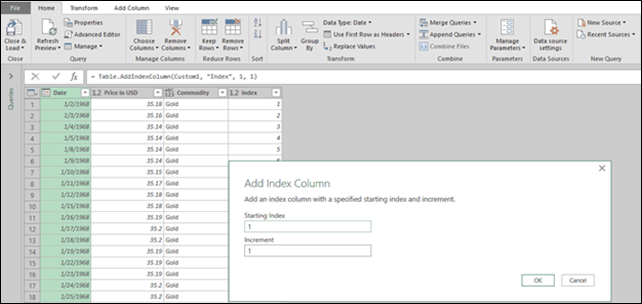
Now I add an index column again, and this time I chose to start the index column from 1.
In this way, the row that has an index of 0 in the Zero table is now indexed as 1.
I rename the new table One to improve the readability.
At this point, I’m ready to merge the tables Zero and One. I use Merge Queries from the home ribbon. I merge the One table and the Current table based on the Commodity and Index columns. After creating the step, I change the created row to merge Zero and One instead of One and One.
So now it looks like this:
= Table.NestedJoin(Zero,{“Commodity”, “Index”},One,{“Commodity”, “Index”},”One”,JoinKind.LeftOuter).
This merges each row with the row that comes before (if it is the same commodity)
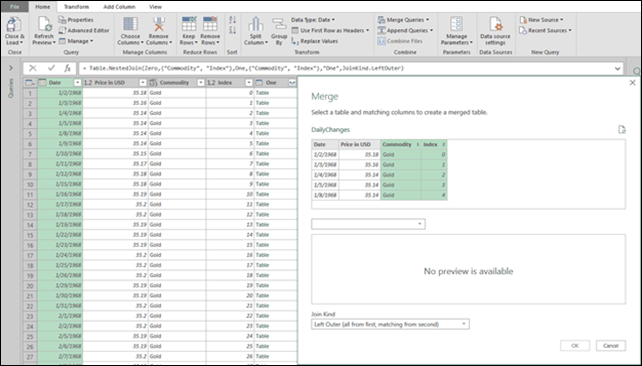
I expand some columns from the table column added by the merge.
The first day in each commodity does not have a previous row, so I remove them by filtering out null values. Now I select the two date fields and add a new column that calculates the duration in days between two consecutive rows that are now merged.
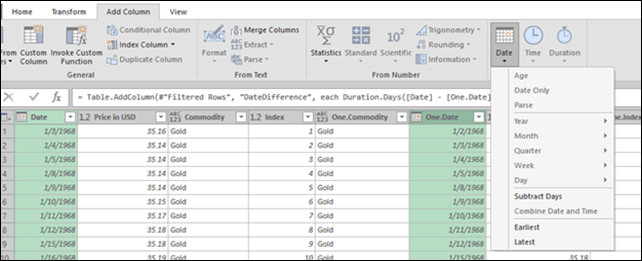
In a similar way, I calculate the difference in price between the price and previous price.
Another calculated column is a division between the difference in price and the previous price

To the created calculation I manually add another element so it becomes
= Table.AddColumn(#”Renamed Columns”, “Inserted Division”, each [Change in USD] / [One.Price in USD] / [Days], type number).
I divide the price change by the number of days between consecutive rows.
We are almost there. I rename all created columns, remove columns I don’t need, and I am ready to load.
I’ll leave the explanation about the presentation of the data to the next time because there is a lot to be said about creating the dashboard that visualizes the historic prices.
In the meantime, the dashboard is in the file, investigate the price history of these two metals and see what insights you can find!
Where It’s At: The Intersection of Biz, Human, and Tech*
We “give away” business-value-creating and escape-the-box-inspiring content like this article in part to show you that we’re not your average “tools” consulting firm. We’re sharp on the toolset for sure, but also on what makes businesses AND human beings “go.”
In three days’ time imagine what we can do for your bottom line. You should seriously consider finding out 🙂
* – unless, of course, you have two turntables and a microphone. We hear a lot of things are also located there.
Get in touch with a P3 team member