
Hijacking the R Visual
Power BI comes stocked with a great set of visuals that keep getting better (more options to do multiples, please)
Power BI comes stocked with a great set of visuals that keep getting better (more options to do multiples, please)
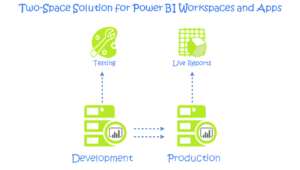
Today, we’ll look at Power BI workspaces, apps, and how to keep changes from mucking up reports. In the software development lifecycle, a distinct space to test new reports ensures consistent results.

A long time ago a peer in Financial Planning and Analysis said “Financial Planning starts in the home.” I modified the statement to “Data analytics starts in the home.”

n today’s fast-paced digital world, information is power, especially when it comes to mastering the intricacies of software development and deployment.

My new seminar’s mission is to provide business leaders with easy-to-follow recipes for data-driven success
In a recent post, I hinted that I’d be using the Football Project V2 as my “platform” for some future techniques-oriented posts. T

The autoexist logic magically removes combinations that don’t exist, but only for columns in the same table. Also, Cross Table Filtering…
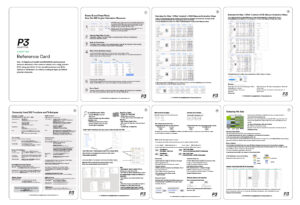
A long time coming… The Finalized 8-Page “Reference Card V2” – Download it for Free Below Yes, this took me forever. I first posted about it more than

Director of Product Management, Microsoft BI
One of the many things I love about Power Pivot and Power Query is that these tools have put BI into the hands of users

Last month I posted a survey of computer performance for Power Pivot and Power BI usage.
What can I say folks. The Power Pivot “biz” continues to gain steam (one indicator: last week recorded the highest traffic ever to this site) and that means busy days here at P3 Adaptive HQ.