There are people (at least I assume they exist) that plan out the words flying out of their mouths before they actually start speaking. Those people lack imagination and an appreciation for the true art of throwing caution to the wind and blurting out whatever pops into your head. It works fine for me a good 80-90% of the time! I like to write blog posts the same way! Even I have no idea what is about to happen, but I’m pretty excited. Also, there are people (and I know these exist – Chris Webb comes to mind) that don’t like to write blog posts against topics that have already covered. Ya, I’m not that guy either. Heck, I repeat my own posts sometimes. In this case, the topics of AutoExist and Cross Table Filtering were understood by like 3 or 4 people about six years ago… so pretty good chance you didn’t know about these topics and if you did… you probably didn’t understand the posts anyway. I know I didn’t. For that matter, I still don’t, but do I seem like the kind of guy that is bothered by such trivialities?
AutoExist
So, look. AutoExist has already been written about. Quite a lot. Feel free to comment with “Dude, we get it… ” and *I* promise not to write about it a 3rd time! Folks that have written about this:
- The Italians: AutoExist and Normalization – SQLBI
- Microsoft: Key Concepts in MDX: AutoExist
- Rob: Flat Pivot is Slow and Doesn’t Sort Properly
- Me: Power Pivot Hierarchical Data
All of them have a slightly different take on the concept and all are worth reading, imo. That said… this is not something you are going to run into every week.
My claim is that if you work long enough with DAX, you will run into this… likely as a performance issue, but possibly as “weird results” from your measures, and then… you will be glad you at least heard about this concept. So, store it away. And if nothing else, it is interesting…
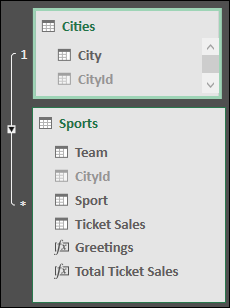
Let’s start by creating a simple model (at right) and one simple measure:

[Total Ticket Sales] := SUM(Sports[Ticket Sales])
We have a few professional sports team, using a Cities lookup table. I have totally totally invented some bogus

Ticket Sales data. We build a pivot table and all looks about like what we would expect (the upper pivot table, at left).
Other than some unlikely data (in the States, there is no scenario where Soccer/Futbol is going to have more ticket sales than American Football. We really really like our football) – proof the data is fake.
Okay, that was nice I guess – next step is to define a weird and mostly useless measure:
[Greeting] := “Hello”
First, let’s just recognize this is indeed a valid measure. Measures can return text! And hey, they don’t HAVE to do anything interesting/useful… like sum or average a column… they can just return a simple value like “Hello” or 1.23 if you want.
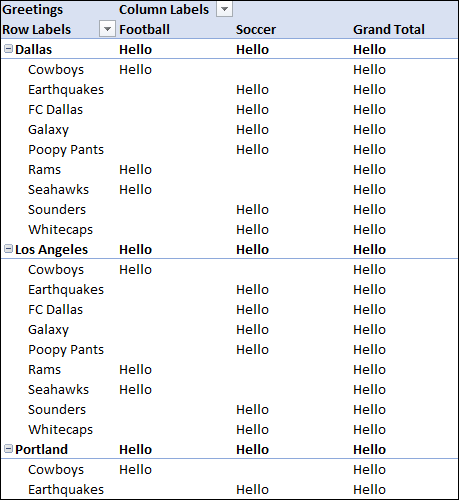
You probably already cheated and looked at the next pivot table, but just in case you have not… think for a moment about what you “expect” to see. My first thought would be that the pivot table would look just like the Total Ticket Sales version… but replace all numbers with “Hello”. Of course, I wouldn’t call it a “first” thought if that were correct.
Indeed the pivot table looks strangely “long”. Though, at least it is friendly – look at how often it is telling us “Hello” ! Where the first pivot correctly shows only Dallas teams (Cowboys and FC Dallas), the second pivot table is showing teams from other cities. Dallas Earthquakes is not a thing!!

Two questions:
1) Why does the first pivot table NOT show Earthquakes under Dallas like the second pivot table?
2) Why are some of the cells in the second pivot table BLANK?
You want the truth, you can’t handle the truth, blah, blah… a few good men.
On 1) the thing to realize is that Dallas is being evaluated against the Earthquakes – and every other sporting team. It’s just that by default, Excel removes rows where every value is BLANK. Our only value being [Total Ticket Sales] which doesn’t exist (eg, is BLANK) for Dallas Earthquakes… those rows are simple tossed out, showing a smaller pivot table.
On 2) is now a good time to admit that the results surprised me too?
Somehow the pivot table (or… something…) knows that the Cowboys are a football team, and the Earthquakes are a soccer team, so it doesn’t bother evaluating Dallas Cowboys… the soccer team. And it doesn’t evaluate FC Dallas the football team. But… well, how does it know?
Btw, what is the most impressive invention of modern times? Computers? Airplanes? No… it’s the thermos. It keeps hot stuff hot. It keeps cool stuff cool. But… how does it know!?? I’m the worst – I’m sorry.
So. Why is it smart enough to know the Cowboys don’t play soccer, but it is not smart enough to know the Earthquakes don’t play in Dallas?
The answer is simple: the cities are in a different table.
There is magic down in the bowels of the DAX engine that knows which combinations of column values exist… automatically. exist. automatically. autoexist. AUTOEXIST!
The “autoexist” logic magically removes combinations that don’t exist, but… only for columns in the same table. If the columns are in different tables, all bets are off… it is going to try to evaluate every combination. And… in the vast majority of cases you do not care. If everything is working and performance is good – awesome! Grab yourself the beverage of your choice, congratulate yourself on a job well done, and move along w/ your life.
However, given the knowledge of how columns from multiple tables interact… you can see how building a pivot table with lots of columns from different tables could create some performance problems. Grab a column from a geography table of 2000 rows, one from 4000 customer table and one from 500 rows of products, and you are evaluating 2000*4000*500 combinations… and throwing away the vast majority as blanks. Something like 3 billion combinations? Zoinks!
The important thing here is simply awareness, but a few points:
- If possible, avoid “detail” reports – that have lots of columns. They make the ouchy.
- If you need detail reports, consider using the trick from Rob’s article linked above.
- Denormalize tables to avoid snowflake schema… as more tables simply increases the odds of running into this problem. In our example, if we simply pulled the cities into the sport table… problem solved! No more Dallas Earthquakes…!
- Beware that in some interesting situations… we aren’t just talking about a performance issue, but bad results from your measure – be sure to read the post linked above at SQLBI.
Cross Table Filtering
To continue our theme of discussing things that are hard to understand, I have read this post about Cross Table Filtering more times than I can count – and each time I get some new little nugget of info and a good heap of “what in the hell is he even talking about?” https://mdxdax.blogspot.com/2011/03/logic-behind-magic-of-dax-cross-table.html
This is a deep discussion about filter context, how it flows between tables, the impact of ALL( ) in both top and non-top level filters, and … well, just go read it. It’s pretty intense.
How is it that I’m on my 4th year of using DAX about every day, and I still don’t understand everything in the article? Two words: Jeffrey. Freakin. Wang. Jeffery is basically the father of DAX and current engineering manager overseeing the DAX engine. I heard him speak at our local user group about a year ago and it was amazing how much Cross Table Filtering knowledge he was dumping on us. I can’t wait to listen to him again. I wonder when that will be…
Wait, what’s that? He is speaking at the next Modern Excel / Power BI User Group in Seattle!? Hurray for me!
Seriously, if you are in the area… this isn’t one to miss.
And btw… if you are in the Seattle area… I would love to meet you! For almost 4 years, I have been running my independent consultancy at Tiny Lizard. However, hopefully you guys saw the exciting announcement around the creation of Power Pivot Pro – Northwest, or as I like to call it P3NW. Other than providing technical support on projects, my primary role for P3NW is in helping mentor and grow people. People like yourselves. I don’t care if you are seasoned or brand new – I’d love to chat about where you are in your data journey. Drop me a line! I’m “scott” “at” “P3 Adaptive ” “dot com”…
Get in touch with a P3 team member