
The Difference Between Forecasting & Predictive Analytics
Forecasting is when we anticipate the behavior of lots of people on long timelines. Predictive Analytics anticipate the behavior of One person…
 P3 Adaptive
Forecasting is when we anticipate the behavior of lots of people on long timelines. Predictive Analytics anticipate the behavior of One person…

Welcome back readers, to another chapter in the DAX Reanimator Series! The post I’ll be re-envisioning today is one I’m very excited about.

Learn how to use Power Query like a pro and organize your queries by using this very simple technique. Take your queries and organize them in folders.

Greetings P3 Adaptive Nation! I’m here today to talk about maps, maps, globes, charts, topographical representations, and…well frankly I’m out of map synonyms. However there’s at least twice as many […]

Ever noticed that Power Query refresh is slower in Excel than Power BI? Ken Puls, PQ Expert, explains the problem and what you can do to fix it!
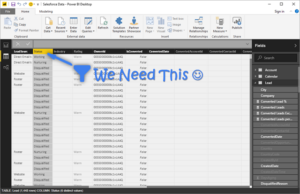
I’m going to keep today’s post short and sweet. The #1 missing feature in Power BI is overwhelmingly clear to me, #2 isn’t close, and addressing this should be quite simple for my friends and former colleagues at Microsoft.
Awhile back I recorded a podcast with John Michaloudis from MyExcelOnline and it went live today. Fun chat, lots of excitement.
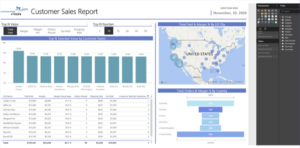
I’d like to drop some reporting knowledge. I’m going to share some of my best practices for Power BI Reporting I’ve developed over the years
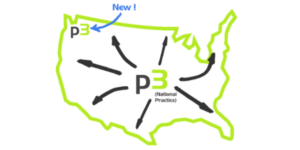
Hardcore “trying on” the Power BI label. Today, even our national practice is doing about a 50/50 mix of Power Pivot vs. Power BI work.

Dynamic TopN Reports via Slicers: Now you can click, slice, interact, touch (…dirty), and drill (dirtier!) with these reports to your hearts desire.

What We Can Do With “Just” DAX and Modeling. It’s my experience-powered belief that you cannot get a Win of that size without leveraging DAX and Modeling.

You should advance to Intermediate in DAX before advancing to Intermediate in Power Query / M, and then to Mastery of DAX before Mastery of M.
