Bringing a Treasure Trove Back into the Light

Guess how many articles are here on p3adaptive.com? Go ahead and think of a number, I’ll wait.
The answer, at time of writing, is 923. Rob alone has published 715 articles! And these date all the way back to 2009.
A lot of these articles are “old,” but folks, the DAX engine is still 99% the same today in Power BI (and Excel 2016) as it was when it first “hit the shelves” in Spring 2010.
The motivation behind this “Reanimator” series, then, is twofold:
- Help newer converts/readers rediscover some of the most-awesome techniques previously covered here (without being so lazy as re-posting them in their original form)
- “Refresh” those techniques for the brave new world of Power BI (since the vast majority of old articles were written when we only had Power Pivot)
What better way to do that than to re-create those workbooks in Power BI Desktop and embed the report directly…Within. This. Post!
A New Age of Self-Service BI Users
I’ve been fortunate enough to be given the honor of sharing with you, our community, all these wonderful posts written by many of our in-house industry experts. Updated in all their glory into the wonderful world of Power BI. Now you can click, slice, interact, touch (…dirty), and drill (dirtier!) with these reports to your hearts desire. Just as the BI gods intended them to be! My hope is that these updates will instill these tools to the growing number self-service BI users just getting into the field and who want to do AWESOME things with their reports.
Highlights From The Original Post(s)
So this update is actually a continuation of not just one…but TWO posts written by Rob in the distance past of 2012 (in technology years that’s basically forever). The two original posts were:
Dynamic TopN Reports Using PowerPivot V2!
Dynamic TopN Reports via Slicers, Part 2

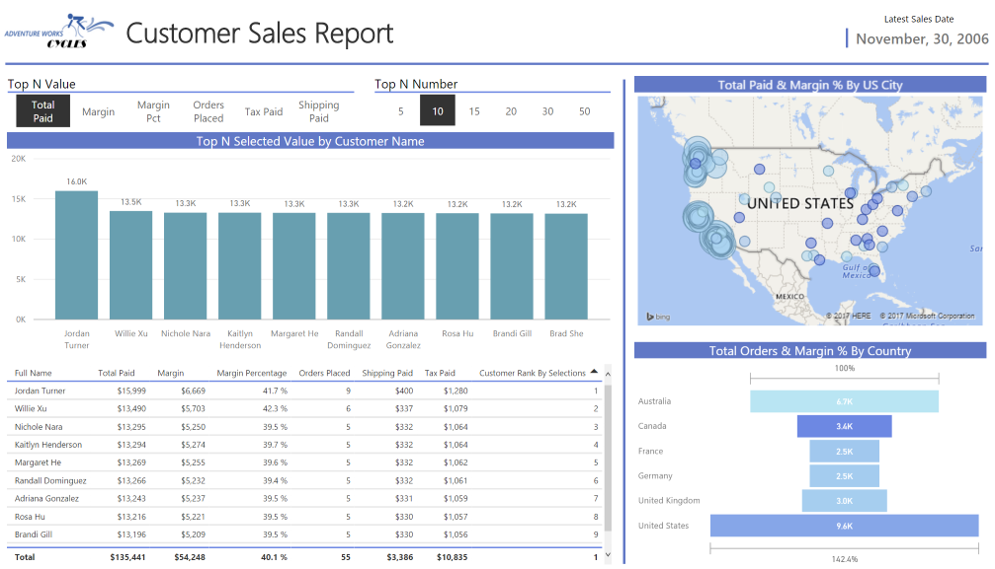
Rob demos some pretty ingenious techniques using his (now prolific) disconnected slicers technique to not only control the Top N Number you’d like to see on charts or graphs, but also the Value that you want to see that Top N Number ranked on. I’ve used it in MANY reports I’ve made over the years, always impressing the customers who used them.
Now I don’t want to give too much away in this post, instead directing you back to the walkthrough via the links above. I’m just here to whet your appetite enough with some fancy Power BI Reports, and if you want to learn the DAX code, hop into Rob’s posts.
This “Picture” Below is an Interactive Power BI!
Isn’t Something Missing?
Some of our more avid blog readers may be thinking “wasn’t there a THIRD post about TopN filtering?”. Yes, in fact there was. It was written by guest contributor Colin Banfield and is called Dynamic TopN Reports via Slicers, Part 3. It’s a fantastic post which covers ways to add BottomN metrics, Month/Year slicers, and more. I chose not to use that workbook since I wanted to capture the core story from the original posts written by Rob. If you’re inclined however, I recommend reading all three as they will add real value to your DAX tool belt. Until next time P3 Adaptive Nation!
Get Your Files
Get in touch with a P3 team member