Ten Ways to Deliver Business Impact with Power BI
A simple description about ten things Power BI and data can do for you, along with bonus honorable mentions as well.
A description on how to import CSV files into Power BI with their filenames.
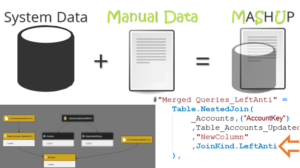
A description on how to simply combine manual and system data in a Power BI Data Model.
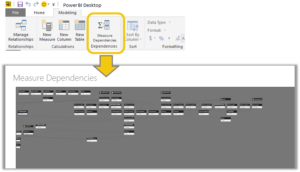
A description on how the Measure Dependency View affects the future of Power BI and how the community can work together to shape it.
In today’s fast-paced digital world, information is power, especially when it comes to mastering the intricacies of software development and deployment
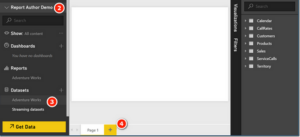
A quick description on how to personalize Power BI dashboards.
Our goal was that financial analysts, rather than wrestling with data and queries, could instead, focus on serving their customer – the business.
I LOVE Pivot Tables – they are (in my view) the best aggregation tool available to the data analyst today
New Feature: Roundtable. Welcome to an experimental new feature here at P3 Adaptive , where members of the team discuss various topics related to Power BI, Power Pivot, and Analytics/BI in general. These conversations take place during the week on our Slack channel, and are then lightly edited for publishing on Friday.
Today I want to go off-topic just a little bit, but in a way that I think is relevant to many of us as professionals. And then bring it home, so to speak, specifically at the intersection of Analytics and Databases.
An article on improving the usability in Power Pivot and Power BI as well as where the current program is at now and how to improve key flaws.
Folks, today I want to share a source of personal pride – literally share it, and make sure YOU experience it