In First Impressions, Power Query Steals the Show
Let’s say I have ten minutes with an “uninitiated” Excel pro – someone who slings VLOOKUP and Pivots all the time, but has no idea that Power Pivot and Power Query exist. And in those ten minutes, I’ve got to quickly demonstrate the capabilities of “Modern Excel” or Power BI (where the former means “Excel with Power Pivot and Power Query”, and the latter contains both of those same technologies).

M “Sets Up” DAX. And then DAX… Spikes Success All Over the Competition.
(If Will Ferrell ever made a volleyball movie, I could imagine him saying something like that)
I’m going to inevitably spend eight minutes on DAX, and then two minutes on Power Query at the end. I favor that 80/20 split because I think that’s a realistic picture of your future as an Agile BI Pro: 80% DAX, 20% Power Query/M.
But for the uninitiated, Power Query is always the sexier demo. Always.
Why is that, and how do I “square” that with my 80/20 ratio, and my stubborn insistence to not “lead” with the sexier demo?
First Impressions “Follow” Existing (Traditional) Workflows
It makes total sense to me actually. Traditional (pre-DAX, pre-M) Excel workflows always have involved a heavy dose of manual data munging. Squashing a folder full of CSV’s together into a single table, for instance, was just as much “a thing” in 2002 as it is now, fifteen years later. If you can reduce that to a few clicks, AND then automate all subsequent “runs” of that work down to a single click, wow, that’s mind-blowing to longtime Excel users.
So the magic of Power Query is instantly apparent and tangible to basically any Excel Pro. They can immediately see how PQ will save them oodles of time and anguish.
The benefits of DAX and relationships, by contrast, are less readily-apparent on first glance. Portable/re-useable formulas that enable rapid iteration, the answering of “emergent” questions in near real-time, as well as a “subdivide and segment” capability? Or how about multi-data-table capabilities that provide an integrated and convenient view across many different sources of formerly-siloed data? These concepts are simply alien to the longtime Excel user, even though they are MONSTERS in terms of their biz value (as well as time-savers and anguish-reducers). None of the impact “lands” up front because it can’t adequately be contemplated until you’ve started DOING it.
“Help me do what I already do, faster” is FAR easier to absorb than “blow the doors off my existing world, unlocking entirely-new workflows.”

“OK… But if Power Query Sets Up DAX, Why Learn it Second?”
Yeah, fair question – PQ does get used FIRST, prior to DAX and Relationships, in any XLSX or PBIX file you create. So, um, why do I say learn it second?
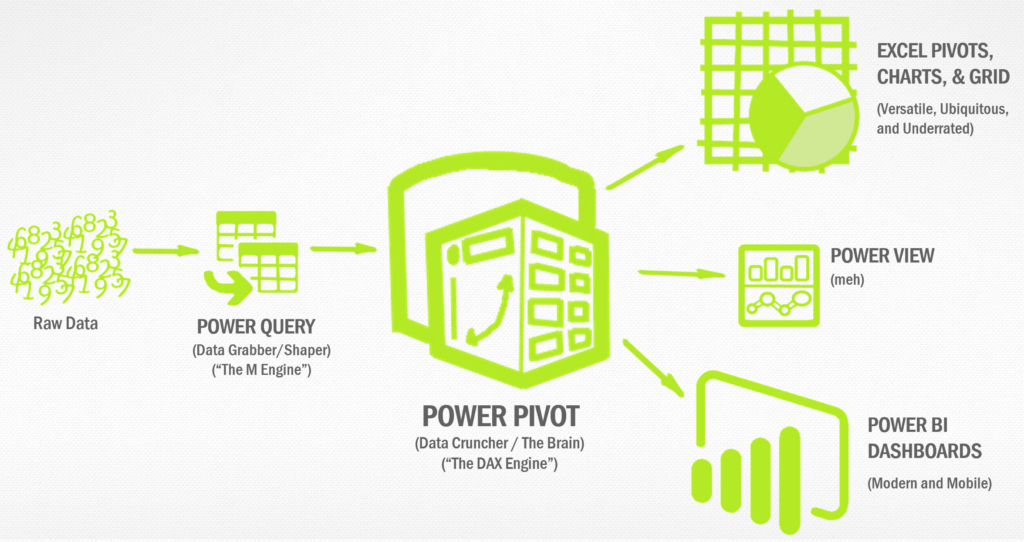
Here’s a slide we use fairly often, in which we illustrate the relationship between Power Query (aka the M engine) and Power Pivot (aka the DAX/Relationships engine):

Power Query/M is a “Preprocessor/Cleaner” for Data Before it’s Fed to DAX
So let’s say that Power Query “feeds” the DAX / Power Pivot engine.
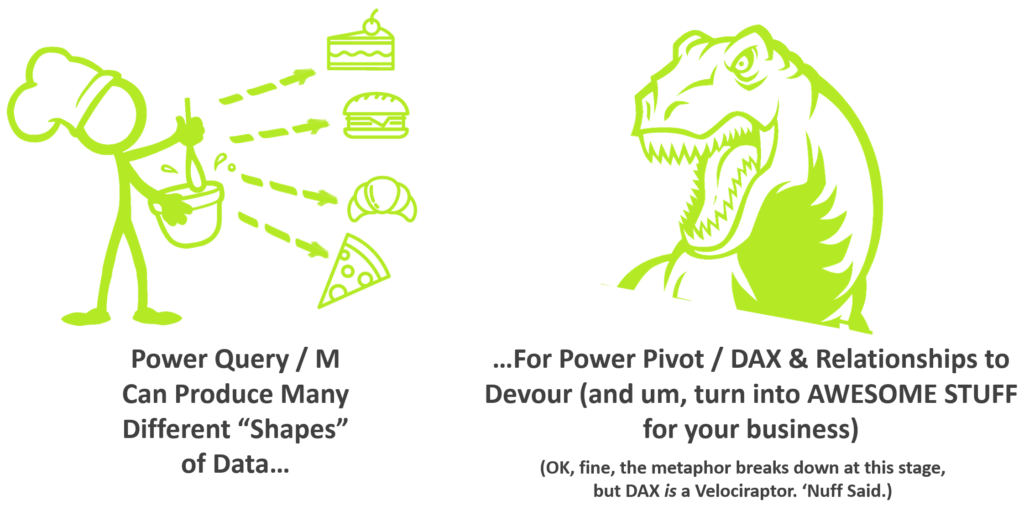
And Power Query can “make” just about anything (in terms of output data shapes) – let’s start out using cake, burgers, croissants, and pizza as a demonstration of its culinary range…

Well then… what does the DAX engine like to eat? Shouldn’t we get to know it better first? What if it has dietary preferences, allergies, or other particular needs?

Interested in Learning How to Do this Kind of Thing?

Our New Online Power Query Course just launched this year. You’ll learn Power Query from the best in the business, two Excel MVPs Ken Puls and Miguel Escobar. We’ve included 7 Hours of Self-Paced Video over 31 Courses, with lots of example files, and a Digital Badge powered by Acclaim.
CLICK HERE to claim your spot.
“A bit overwrought in the metaphor department, perhaps?”
Sure, fine, but let’s ride it to its conclusion, if for no other reason than we employed a lot of clipart in the making of this post and clipart needs jobs, too.
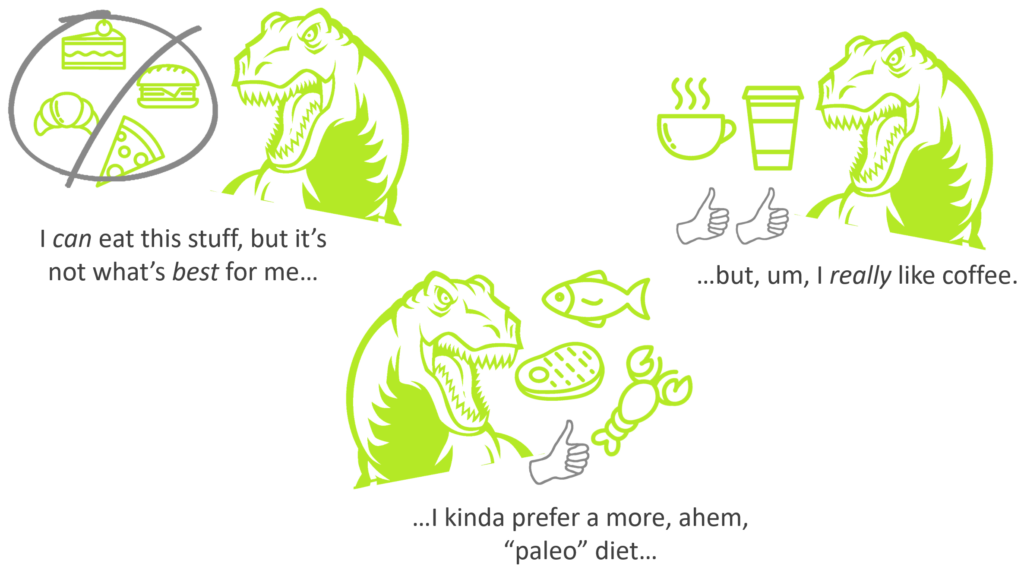
Here’s the gist: if DAX is where the transformative power truly lies (which is true), and it has strong preferences about the shapes of data you feed it (also true), we need to understand that before we can use Power Query / M properly.
And some of the things it likes/prefers might NOT be things we’d even think to “cook” (hence the coffee example above). So, we need to get a feel for what DAX likes to eat.
“Do you really mean I should master DAX and then start using Power Query?”
No, nothing so extreme. What I’m really cautioning about are the dangers of an insidious disease, Queryus Infatuationus, that tends to strike adopters of Modern Excel and Power BI in their early days of usage.
In short, the malady is this: “look, I’ve got this cool new M hammer! It’s the answer to my dreams and clearly I should use it for everything!”
I’ve seen M used extensively as an analysis tool, for instance, and that is Not What You Want to Do. Using M to pre-aggregate and analyze data (instead of DAX), is akin to using SQL for that same purpose (also instead of DAX), and I’ve written about the latter before. Short version: you sacrifice all those lovely benefits of portable formulas I mentioned at the beginning of this article (iteration, answering emerging questions, subdivide and segment, etc.)
Bottom line: in the early going you are going to be learning both (unless all your data lives in databases, and the admins of said databases are willing to make changes for you – in which case you may not need Power Query / M very much).
I’m suggesting, specifically, that you should advance to Intermediate skill in DAX before advancing to Intermediate skill in Power Query / M, and then to Mastery of DAX before Mastery of M.
Another take on this: if you’re learning to write M scripts from scratch (as opposed to getting by with the toolbar buttons and the occasional google search for a snippet of M), and you haven’t yet conquered CALCULATE, ALL, and FILTER, you’re probably getting too deep into M at the expense of your DAX skill.
Parting Disclosure
I think it’s only honest at this point to say that “getting by with the toolbar buttons and the occasional google search for a snippet of M” is exactly where *I* am at personally with Power Query / M.
On one hand, you may read that and say “oh great, he’s just advising us to be like him so he doesn’t feel bad.” Even I wondered about that a bit, while writing this article – I was on the lookout for my own confirmation bias because my inner critic doesn’t stay inner – he sits on my shoulder while I write. And I’m very much aware that at my own company, I rank in the bottom 10 percentile when it comes to M.
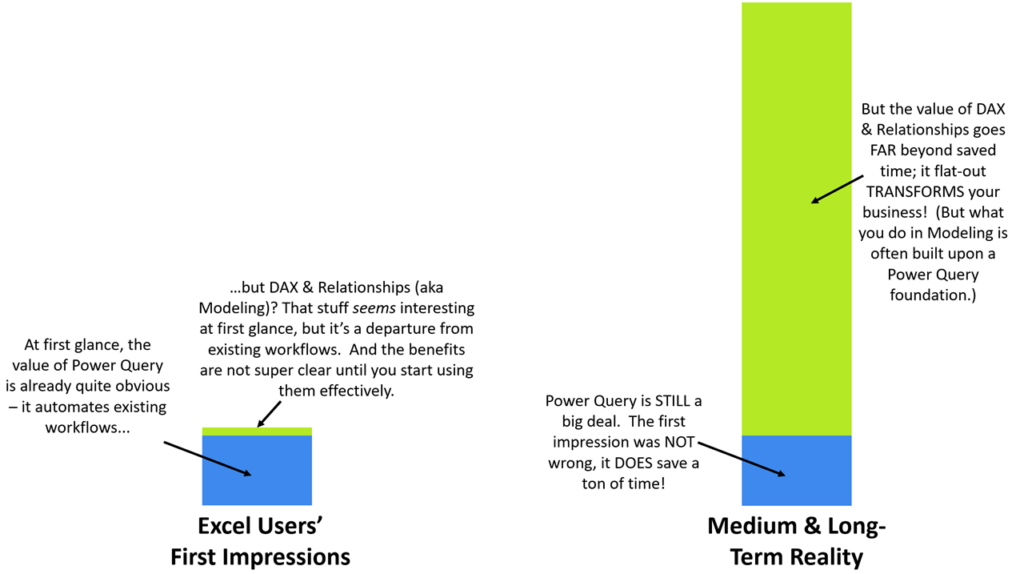
But on the other hand, I’m very confident in my assertion that M is not the ideal producer of final results – you don’t want to feed M output directly into visualization layers. The bar charts at the top of this article paint a proper picture – you don’t get any of the Ten Things Data Can Do For You until you learn how to wield DAX proficiently. So you absolutely are sacrificing TREMENDOUS capabilities if you leave DAX out of your equation – even if “leaving it out” simply means “not fully leveraging it.” And if you ARE fully leveraging it, it has a “say” in what you should be doing (and learning!) with M.
Go get ‘em.
Get in touch with a P3 team member