Faucet
Our data is open. Go and argue with it.
Real datasets on a governed model, open to anyone. Read what we found, open a report and change the filters, or ask it something nobody wrote a chart for.
Pick a dataset
Every report here started as a question.
3 categories11 datasets17 live reports17 questions answeredno login
NFL
NFL data, open to anyone.
Play-by-play, schedules and outcomes since 1999, joined to whatever else makes them answer a question. Open a report, change the filters, or ask the model something nobody built a chart for.
Live reports
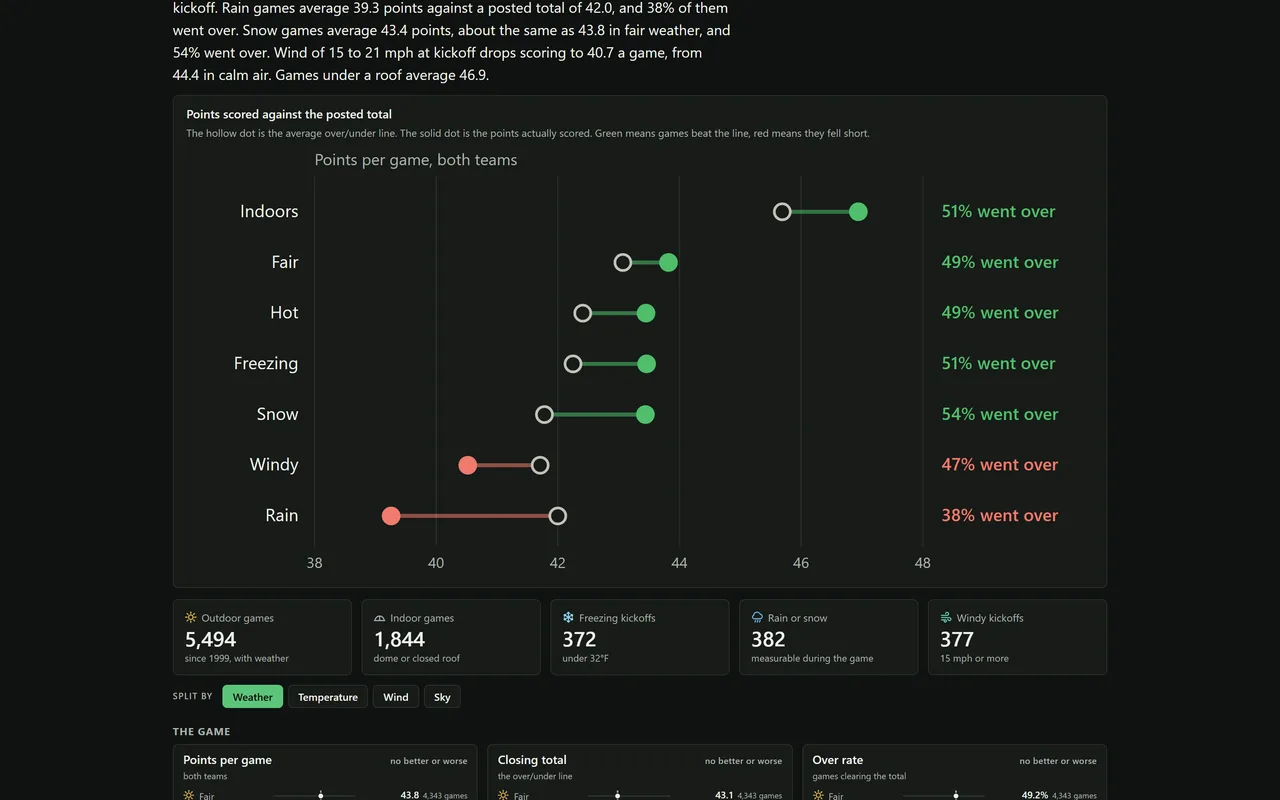 NFL: Weather EffectsScoring, over/unders, kicking, fantasy positions and individual players, filtered by any weather condition.
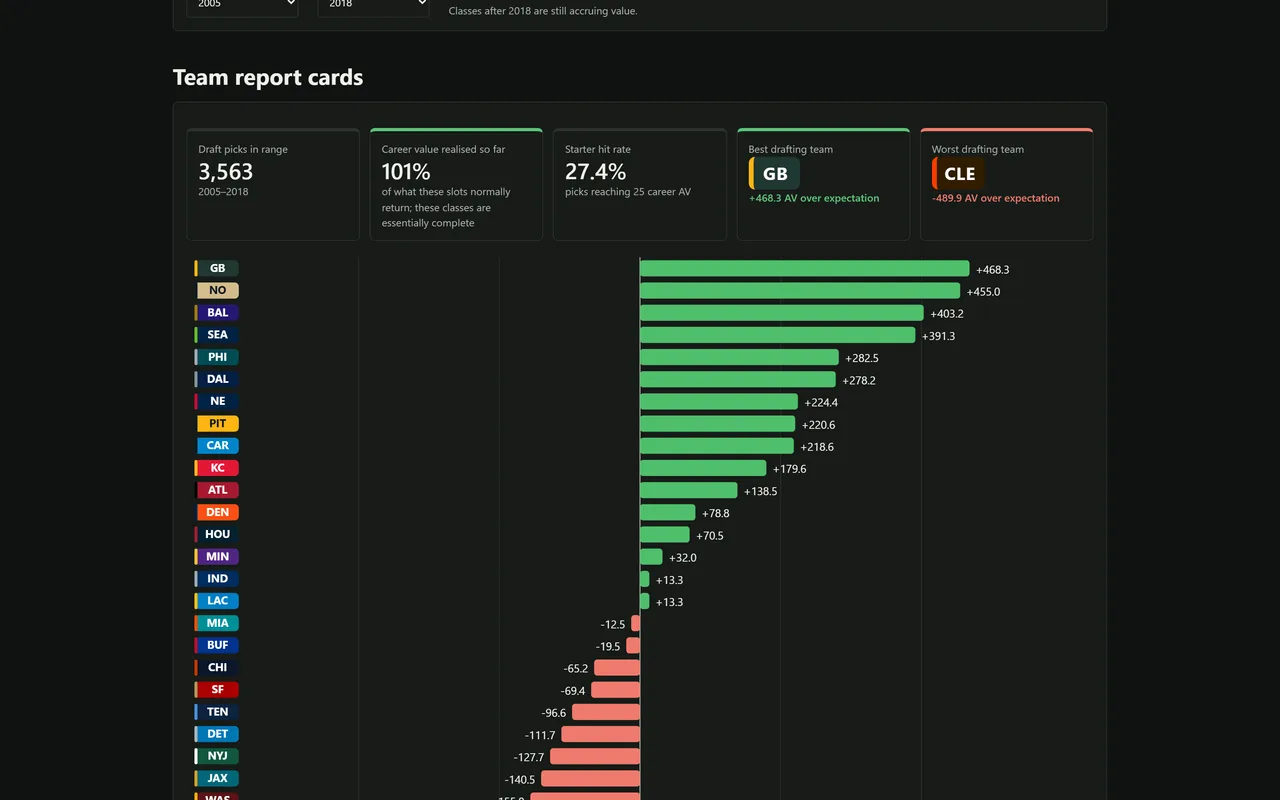 NFL: Draft Return on InvestmentTeam report cards by year range, the pick value curve, position groups by round, and the biggest steals and busts.
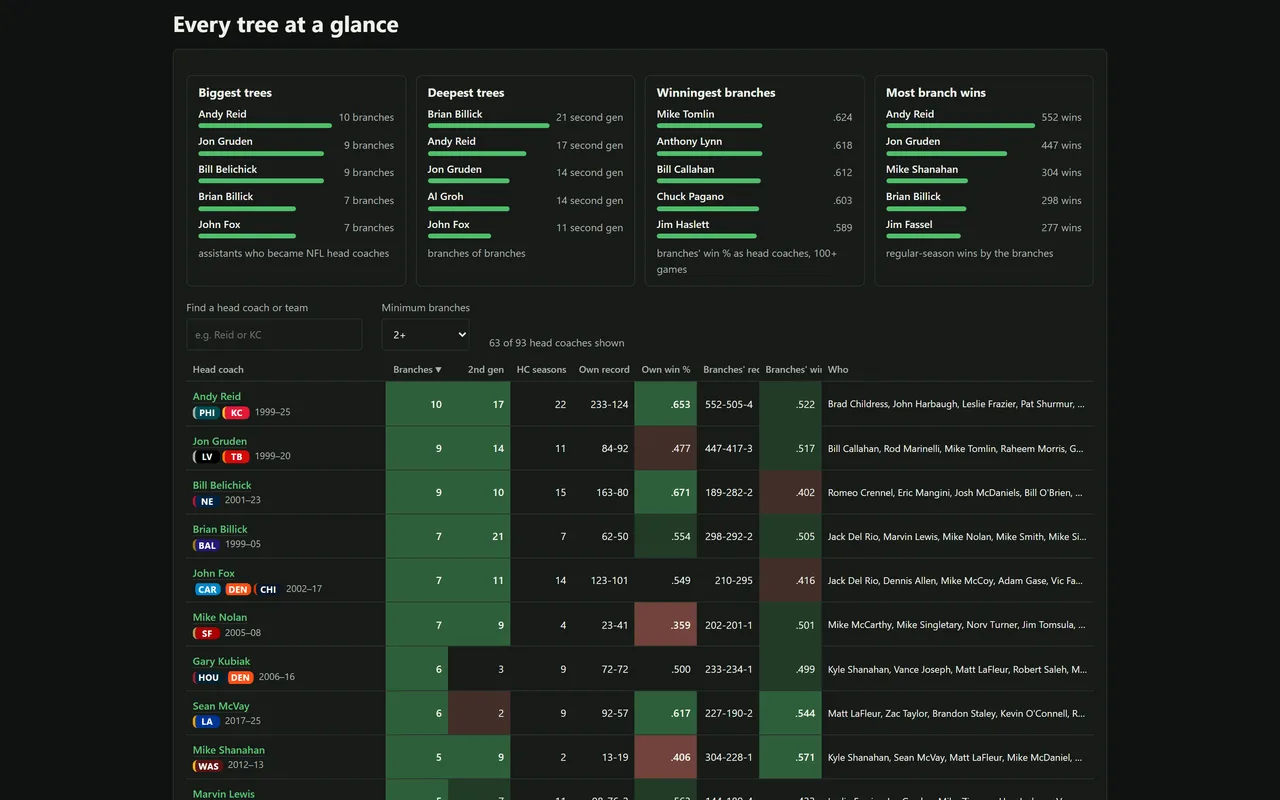 NFL: Coaching TreesEvery head coach ranked by the assistants who went on to run a team, and one coach's tree drawn with branches, second generation and where he came from.
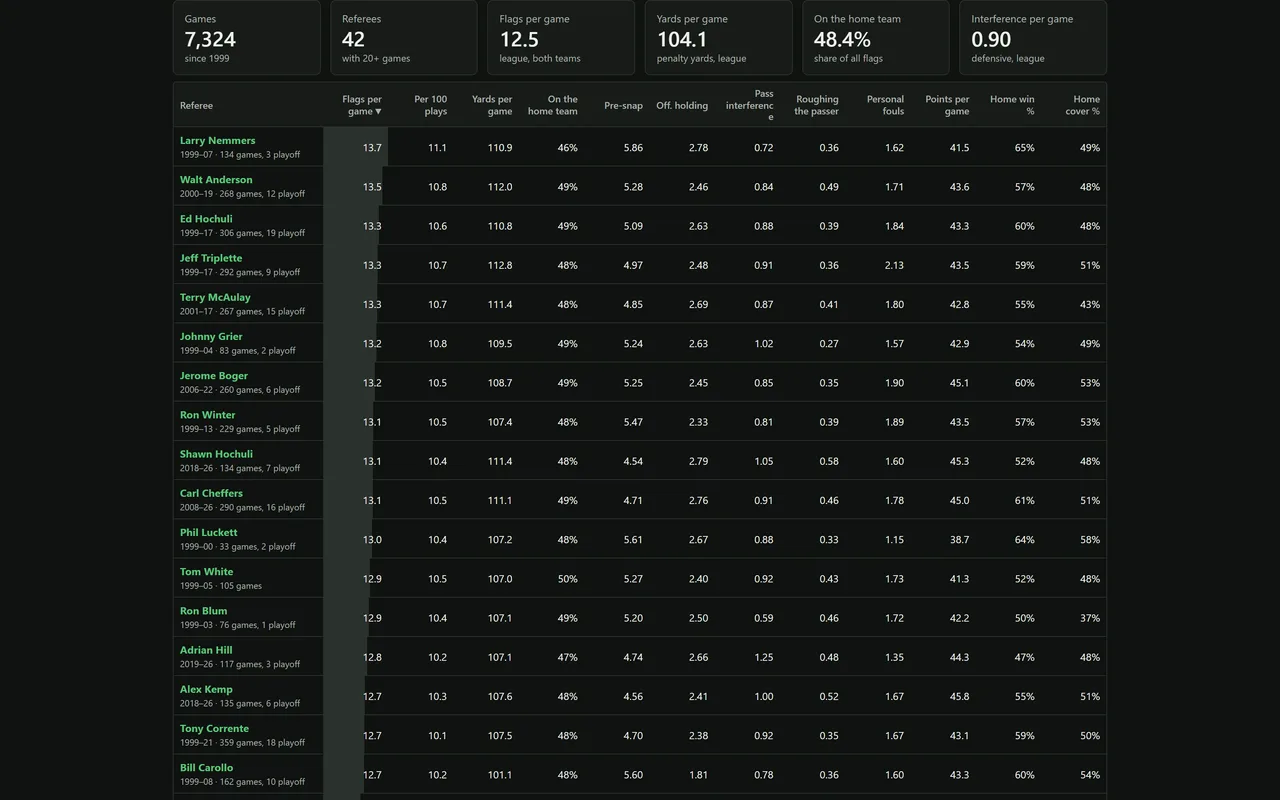 NFL: Zebra ReportA leaderboard of every crew chief, one referee's fingerprint against the rest, each team's flags by referee, the most-flagged games and the league trend by season.
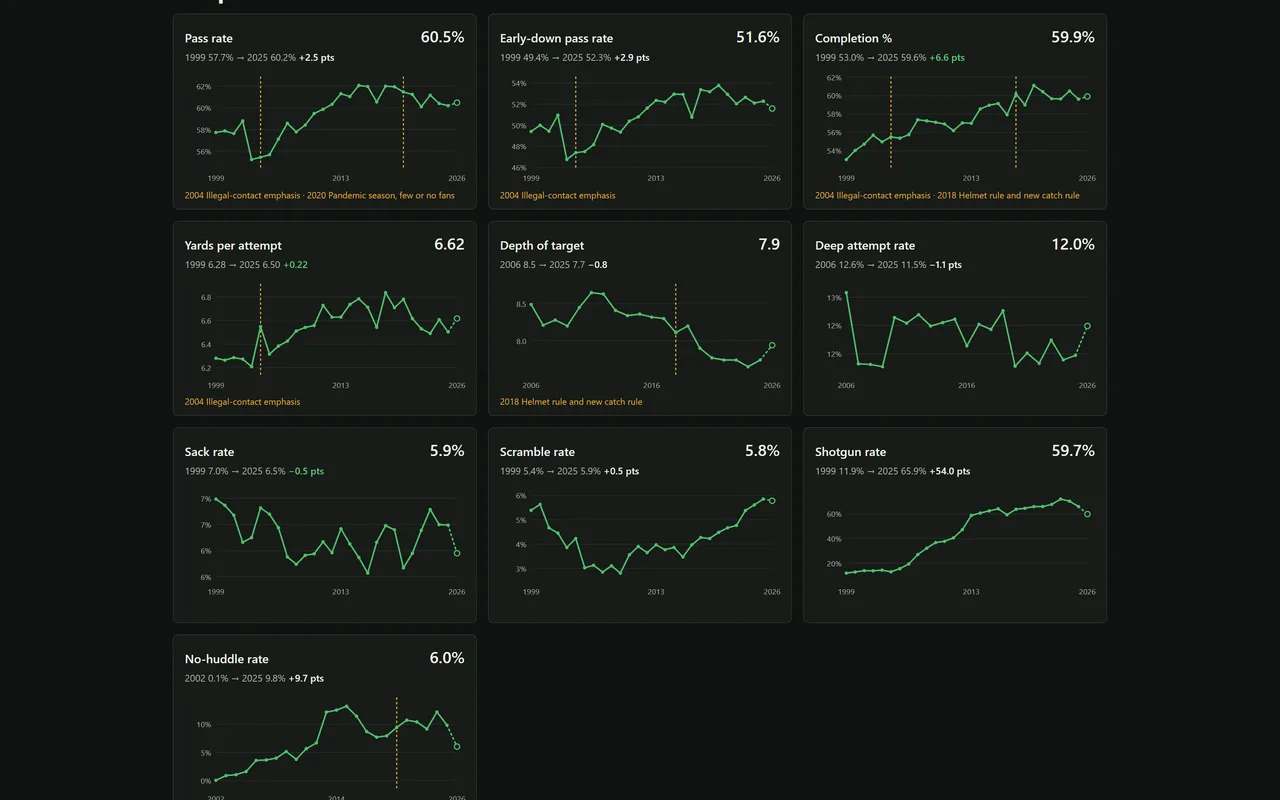 NFL: How the Game ChangedTwenty-seven seasons of league trends as small multiples with the rule changes marked: passing, efficiency, fourth downs, kicking, home field, lines and the ages of the players.
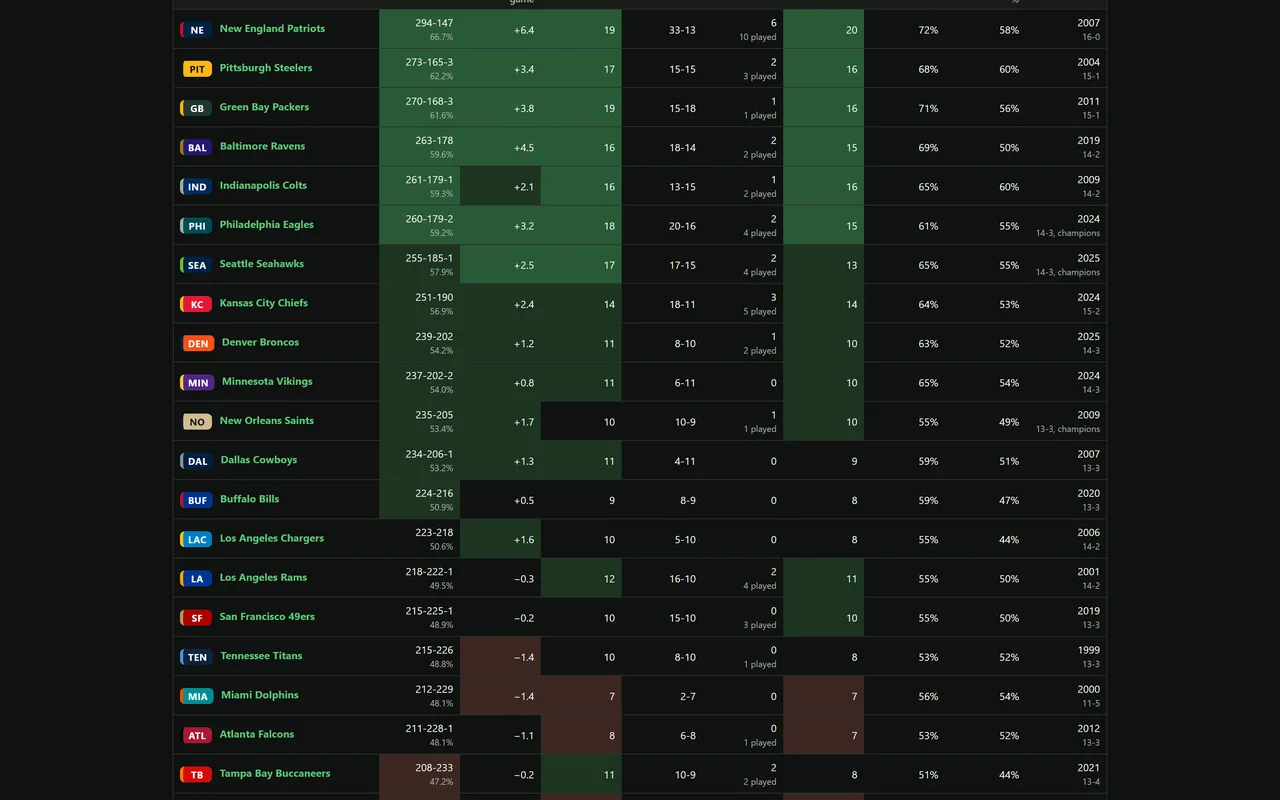 NFL: Franchise ReportAll 32 franchises ranked since 1999, and one team's page of cards: every season, where they win, offense and defense, quarterbacks, coaches, drafting, weather, referees and rivals.
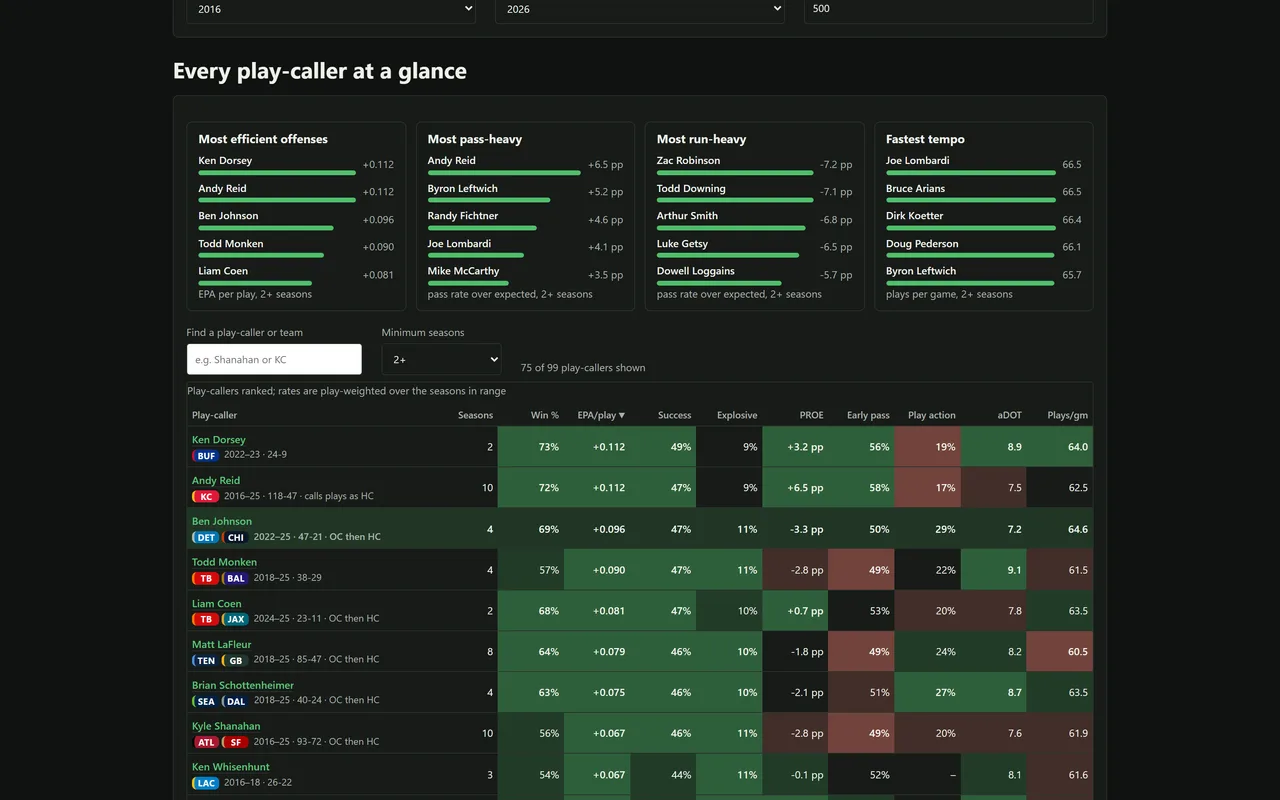 NFL: Play-Caller DNAA leaderboard of every play-caller since 2016, a page per caller with his fingerprint, career stops, nearest neighbours and quarterbacks, and a Tendencies tab for any situation you pick.
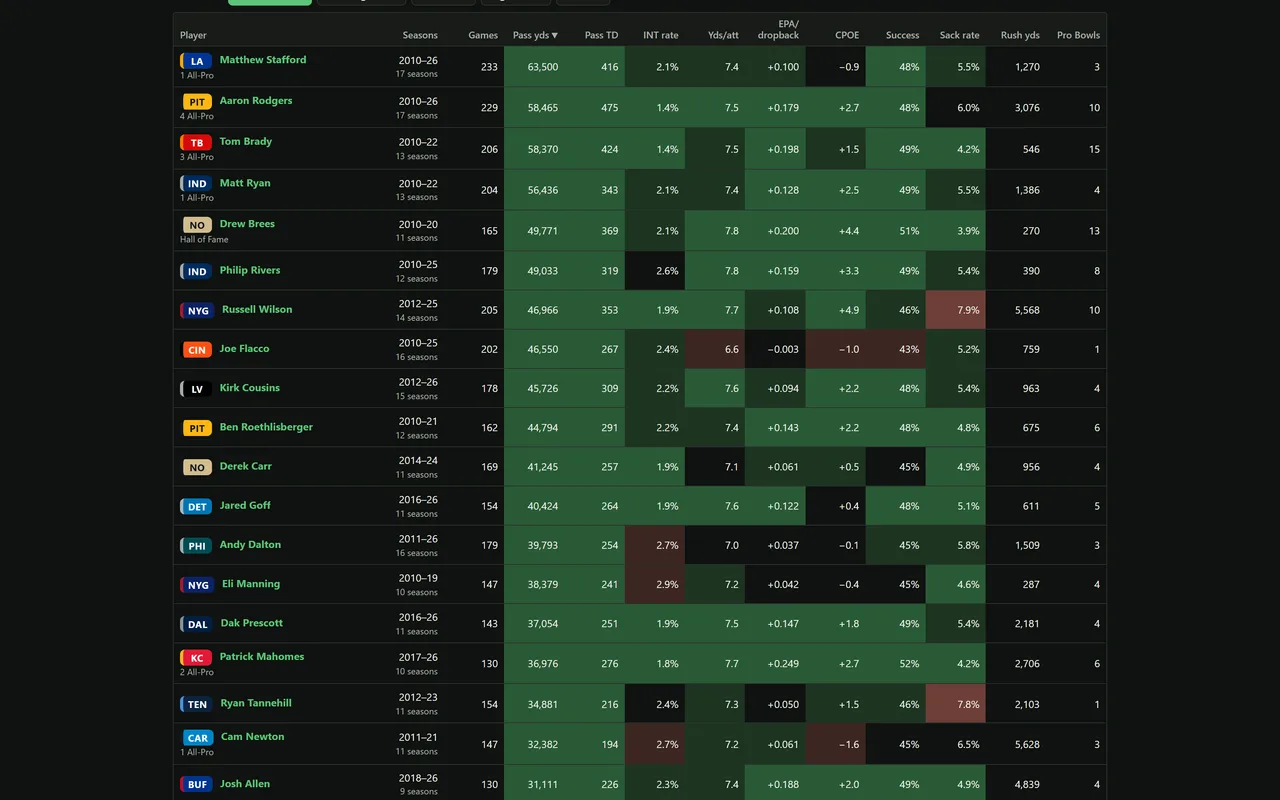 NFL: Player ReportBoards for quarterbacks, backs, receivers, tight ends and kickers over any span of seasons, and one player's page of cards: every season, percentiles, availability, measurables, the money, splits, big games, clutch time, partners and the age curve.
Questions answered
- How does weather affect NFL games?Rain and wind take points off the board and snow does not. Wind is the single biggest factor: scoring falls from 44.4 points a game in calm air to 33.4 above 22 mph.
- Which NFL teams draft best?Over the 2005 to 2018 drafts, Green Bay, New Orleans, Baltimore and Seattle turned their picks into the most career value above what those slots normally return, and Cleveland and the Raiders the least. A first-round pick yields about 44 career AV on average and a seventh-rounder about 6, and the single biggest steal in the data is still Tom Brady at pick 199.
- Which NFL coach has the biggest coaching tree?Andy Reid has produced the most NFL head coaches since 1999: ten of his assistants went on to run a team, one more than Jon Gruden and Bill Belichick. Brian Billick’s tree runs deepest, with 21 second-generation head coaches, and Reid’s protégés have won the most games. Belichick’s nine branches have the worst record of any big tree, 189-282-2.
- Which NFL referees throw the most flags?Since 1999 the league has averaged 12.5 accepted penalties a game. Larry Nemmers’ crews threw the most, 13.7 a game over 134 games, and Alan Eck’s the fewest, 10.9. Among today’s referees Clete Blakeman, Adrian Hill and Brad Rogers run the busiest crews at 12.7 and Eck, John Hussey and Bill Vinovich the quietest. Flags fall on the home team 48.4% of the time, and the Raiders have been flagged more than anyone.
- How has the NFL changed since 1999?The NFL of 2025 passes only a little more than it did in 1999 (60% of plays against 58%) but far more efficiently: completions are up from 53% to 60% of attempts, expected points added per play has turned positive for the first time, turnovers have fallen from 3.8 a game to 2.3, and teams go for it on 23% of fourth downs, double the 1999 rate. Kickers make 86% of field goals instead of 78% and try three times as many from 50 yards. Home teams won 60% of games in 1999 and 54% in 2025.
- Which NFL franchise has been the best since 1999?The Patriots. New England is 293-147 in the regular season since 1999, a 66.6% win rate, with a 33-13 playoff record and six Super Bowl wins in ten appearances; no other franchise is above 62.4% (Pittsburgh) or has more than three titles (Kansas City). Andy Reid has won the most games of any head coach, 282, and Tom Brady the most of any quarterback, 251. The Browns are last at 148-291-1, a 33.8% win rate, with one playoff win.
- Which NFL play-caller runs the best offense?Andy Reid. Over eleven seasons calling Kansas City’s plays, 2016 to 2026, his offenses have averaged 0.113 expected points added per play, a 47.1% success rate and 26.6 points a game, with the most pass-heavy approach in the league at 6.5 points above the expected pass rate. Ken Dorsey’s two Buffalo seasons match him at 0.112, Ben Johnson is third at 0.098 and goes for it on 30% of fourth downs. Mike McCoy (-0.188 over two seasons) and Adam Gase (-0.105 over five) are the worst.
- Who are the best NFL players since 2010?Among quarterbacks with 1,500 dropbacks since 2010, Brock Purdy (0.261 expected points added per dropback) and Patrick Mahomes (0.250 over 5,330 dropbacks) lead, ahead of Peyton Manning, Drew Brees and Tom Brady. Derrick Henry has the most rushing yards, 13,319, and the best EPA per carry of any back with 2,000 carries; Rob Gronkowski (0.561 EPA per target) and Puka Nacua (0.529) are the most efficient receivers; Justin Tucker made 89.1% of 468 field goals.
Housing
Housing and migration data, open to anyone.
Where Americans move, what a home costs where they land, and whether the two are connected: IRS migration returns and Zillow home values for every county, joined so the question can be asked. Open a report, pick your years and your county, or ask the model something nobody built a chart for.
Live reports
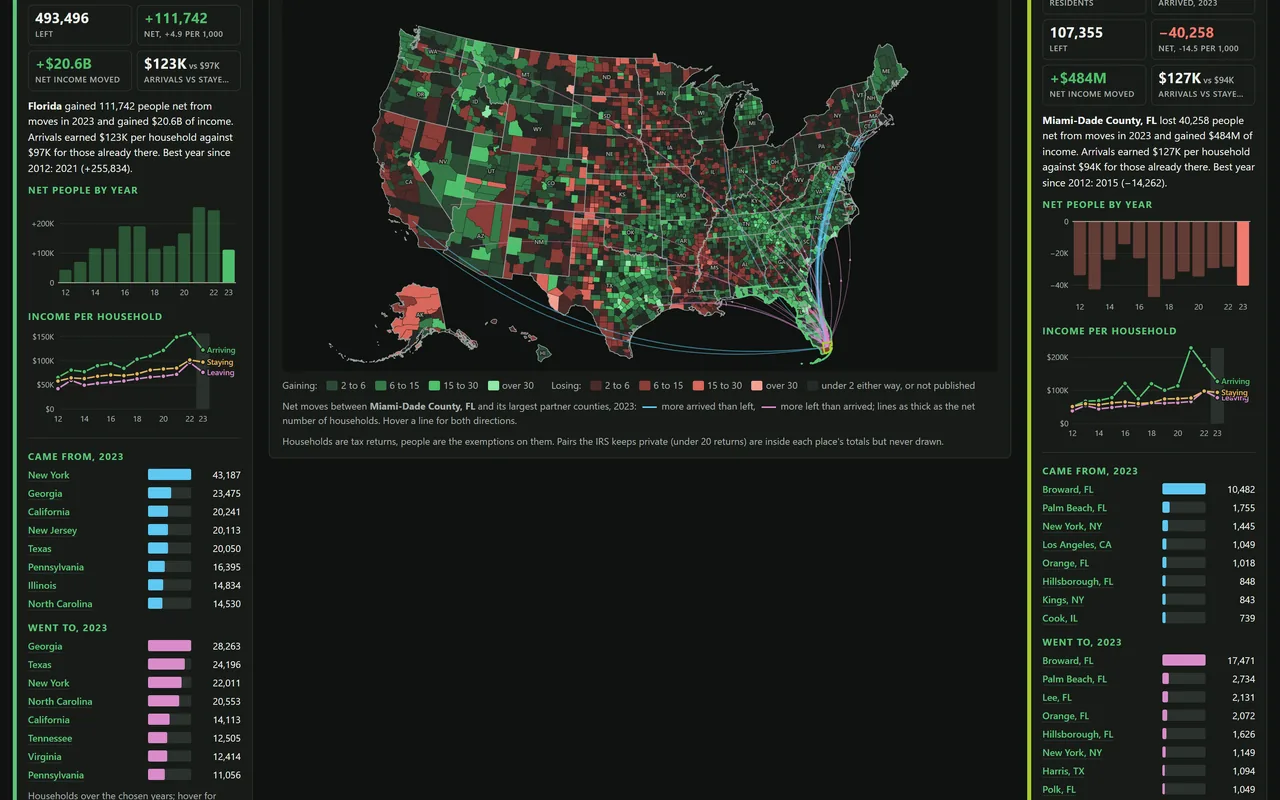 Where America MovedA pan-and-zoom county map of net migration for any range of years, the open state's and county's arrivals, departures, income and partners beside it, and the biggest state-to-state flows and metro rankings.
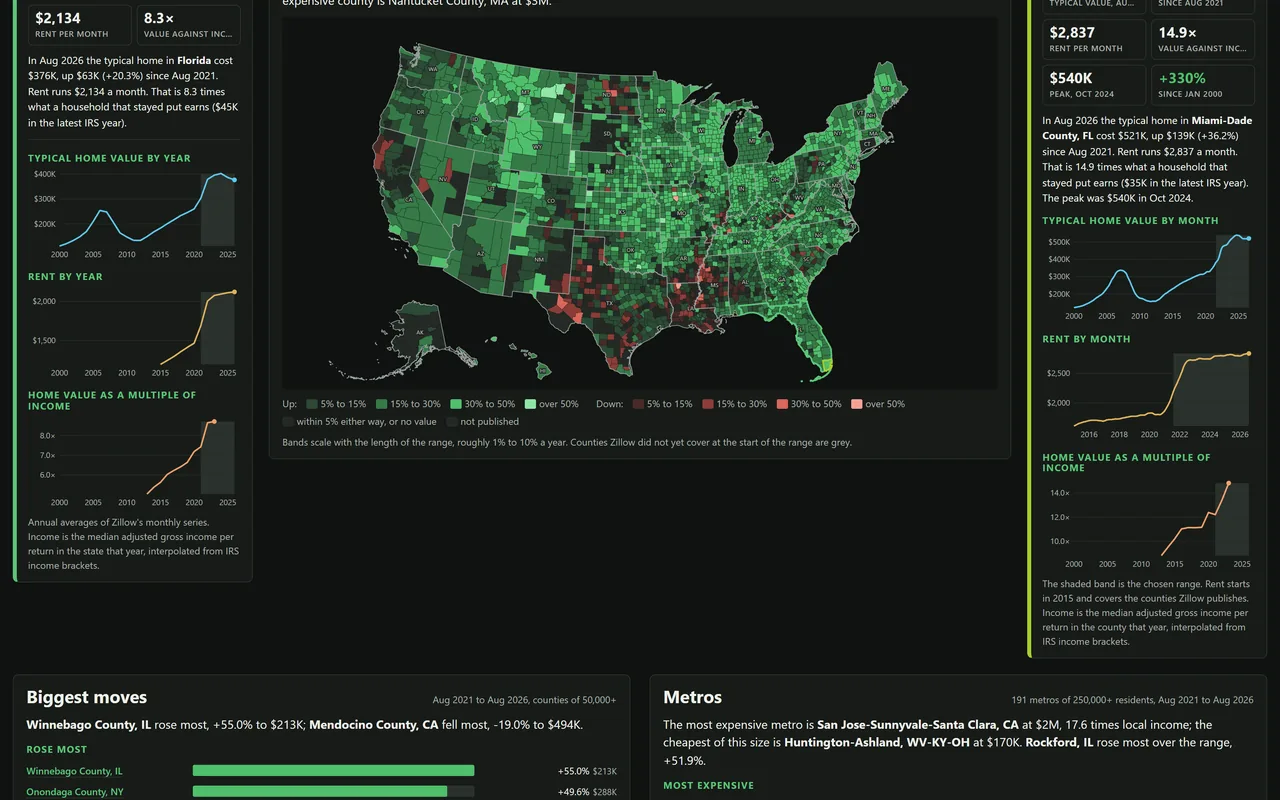 What a Home CostsA pan-and-zoom map of typical home values, their change or their ratio to local income for any two months, the open state and county with monthly history, and the biggest risers and fallers among counties, metros and states.
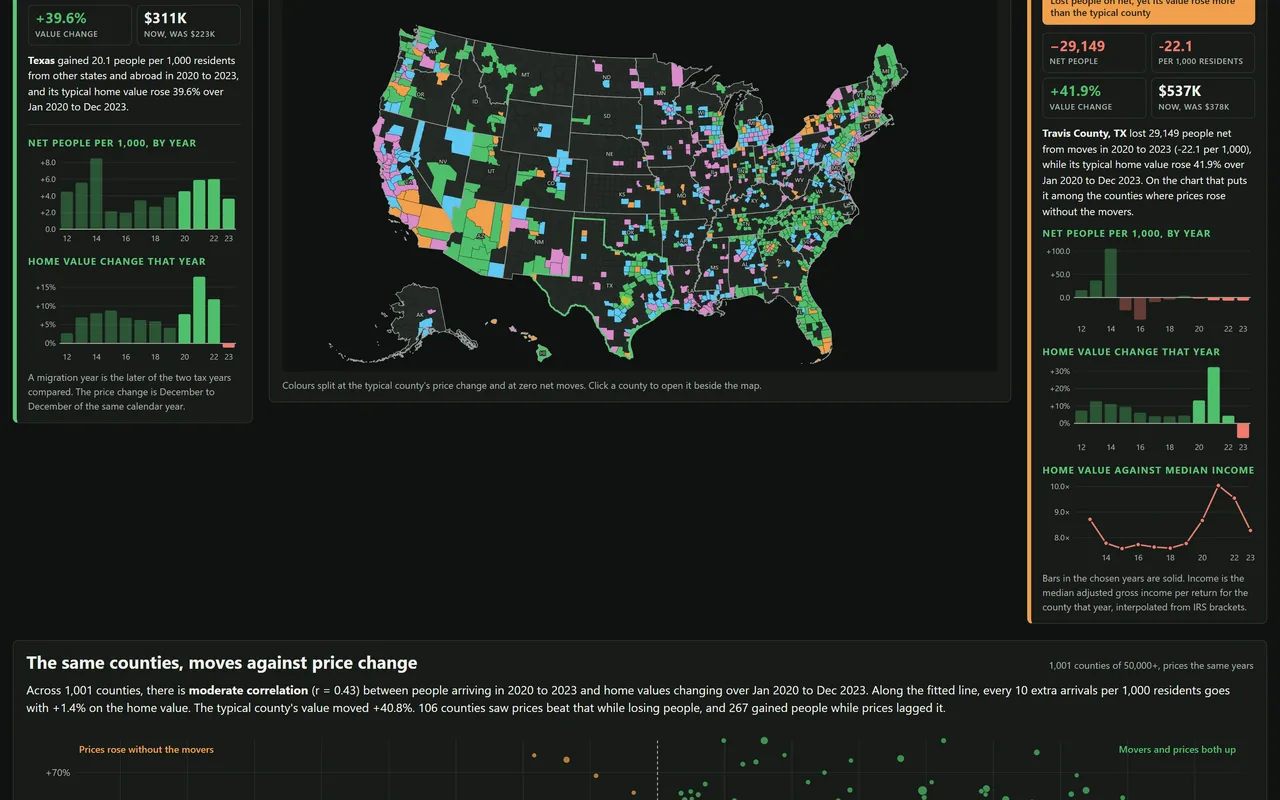 Did the Movers Push Prices Up?Every county's net migration set against its home-value change over the same years: a scatter with a fitted line and correlation, a map coloured by quadrant, and the counties where prices rose without arrivals and arrivals did not move prices. Year range, lag and population floor are selectable.
Questions answered
- Where are Americans moving?South, and to the suburbs. In the 2023 migration year Texas gained a net 112,481 people from other states and Florida 111,742, with South Carolina (11.0 per 1,000 residents) and North Carolina growing fastest for their size; California lost 200,547 and New York 157,970, the steepest rate in the country at 8.0 per 1,000. The single biggest move was California to Texas, 44,417 households. Since 2012 Florida has gained 1.75 million people and 224 billion dollars of income from other states while New York has lost 2.0 million people, and the fastest-growing counties are exurbs of Dallas, Houston, Orlando and Wilmington rather than the big cities themselves.
- How much does a home cost in America?The typical home in the median state was worth 350,800 dollars in August 2026, from 833,300 in Hawaii and 764,200 in California down to 179,500 in West Virginia. Values have risen 23% in the median state since August 2021, most in Connecticut (40%), New Hampshire (36%) and New Jersey (35%), and have fallen in only one place, the District of Columbia (−10%). San Jose is the most expensive metro at 1.54 million dollars and McAllen, Texas the cheapest big one at 193,000; against local incomes, Los Angeles is the least affordable, 18.6 years of the median household’s income, and Pittsburgh the most, 4.3. Rent runs from 2,996 dollars a month in Hawaii to 1,167 in Iowa.
- Do movers push up home prices?Mostly yes, with loud exceptions. Across the 50 states and DC, net migration per 1,000 residents over 2020 to 2023 and the change in typical home value from January 2020 to December 2023 correlate at 0.74: Idaho gained 53 people per 1,000 and its homes rose 54%, Montana 38 and 61%, Florida 35 and 59%, while the District of Columbia lost 61 per 1,000 and rose 6%. At county level the link is weaker (0.43) but holds: counties gaining 40 or more per 1,000 rose a median 50%, counties losing 10 or more a median 34%. The exceptions are where the story is: Miami-Dade lost 49 people per 1,000 and rose 61%, and Austin’s Travis County lost people every year from 2020 while prices rose 32% in 2021 and then fell 8% in 2023.
Flights
US flight data, open to anyone.
Every domestic flight reported to the Bureau of Transportation Statistics since October 1987, 235 million of them, joined to the aircraft that flew them. Which airline, airport, hour, route and plane gets you there on time, and how all of it has changed over 39 years. Open a report, pick your period, or ask the model something nobody built a chart for.
Live reports
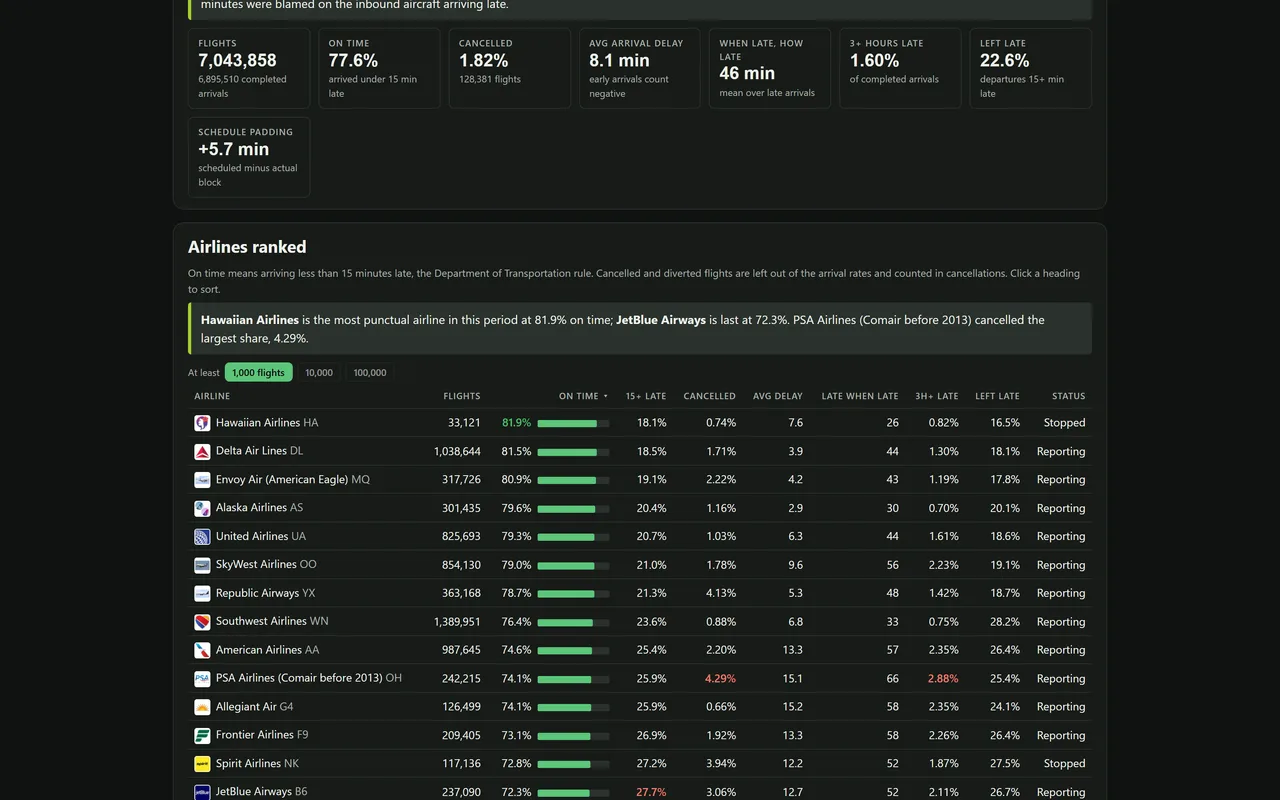 Airline ScorecardEvery airline ranked on on-time arrivals, cancellations, severe delays, delay causes and schedule padding for any period since 1987, with the airlines that no longer exist.
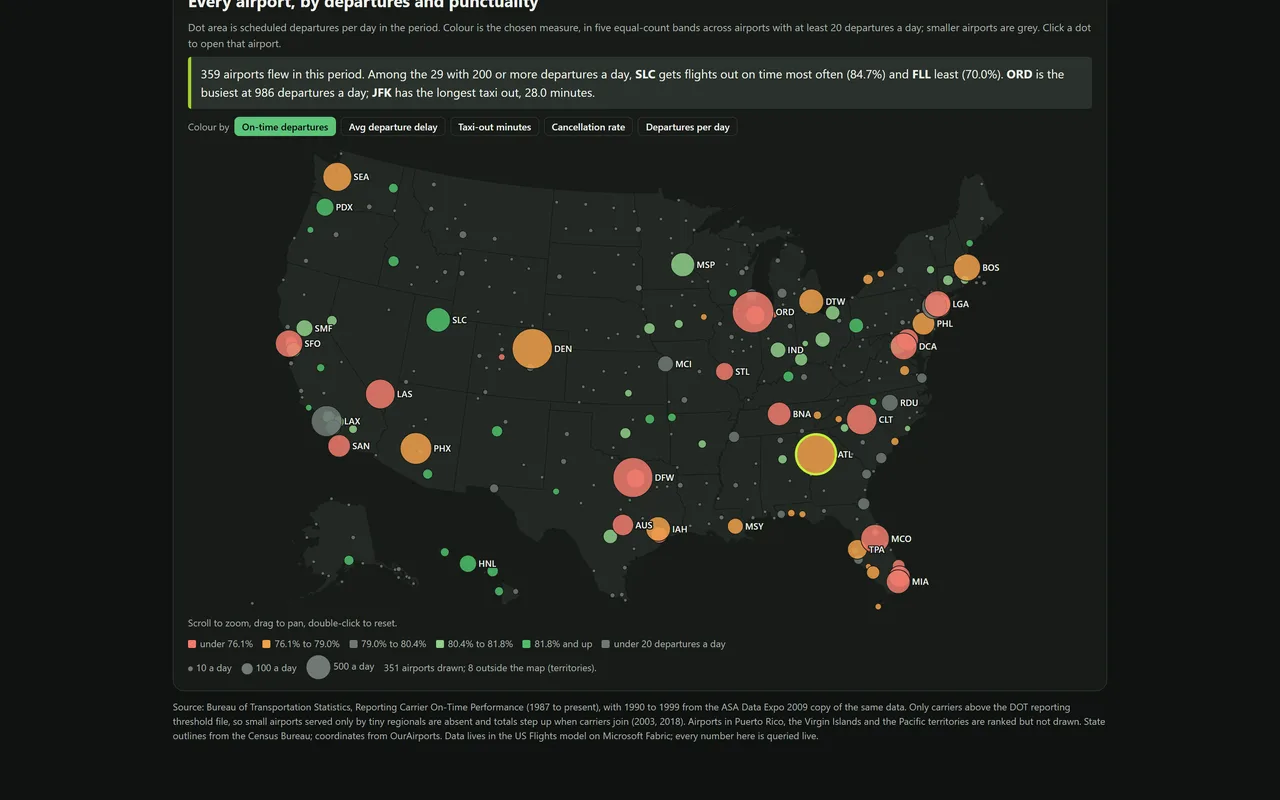 Airport ReportEvery US airport on a map sized by departures, rankings on punctuality, taxi time and delay causes, the hubs that grew or emptied, and one airport’s page of months, years, airlines and destinations.
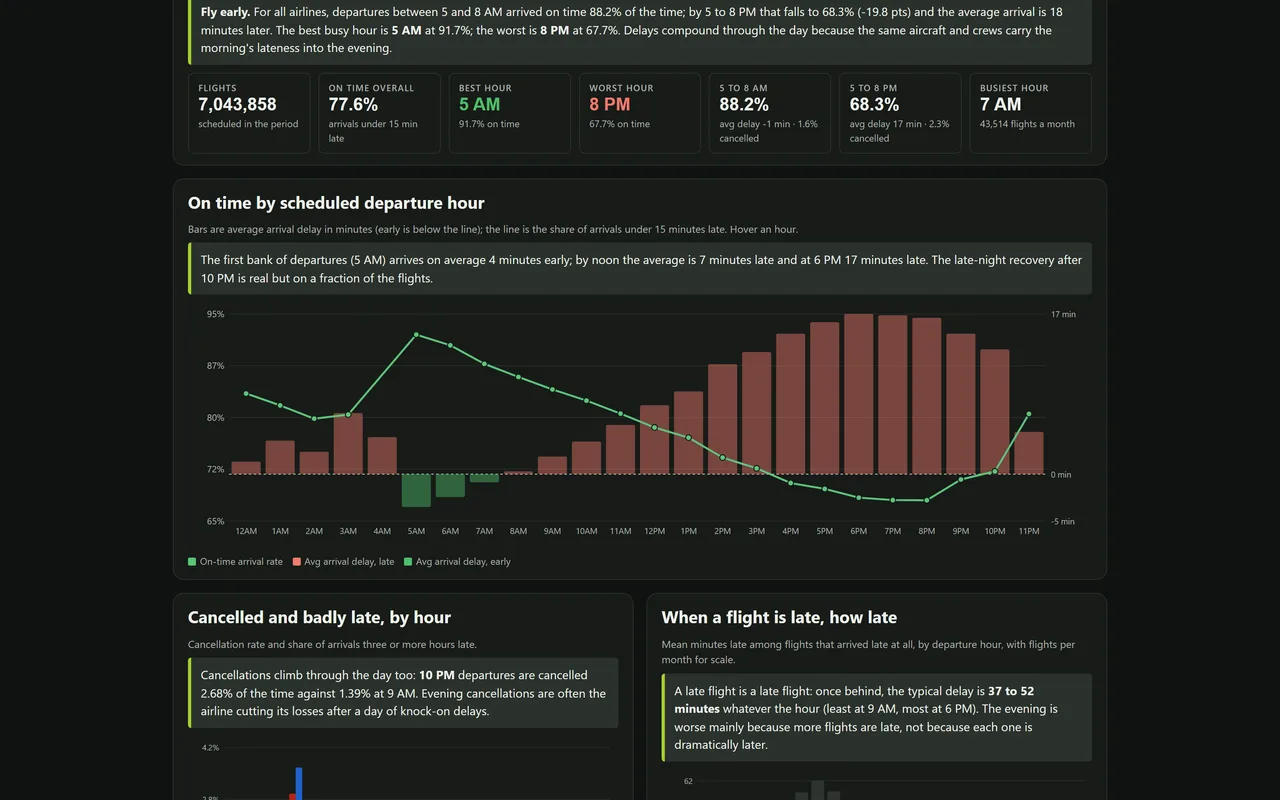 When to FlyThe best departure hour, weekday, month and week to fly, why delays pile up through the day, holiday weeks, and how late is late, for any airline and period.
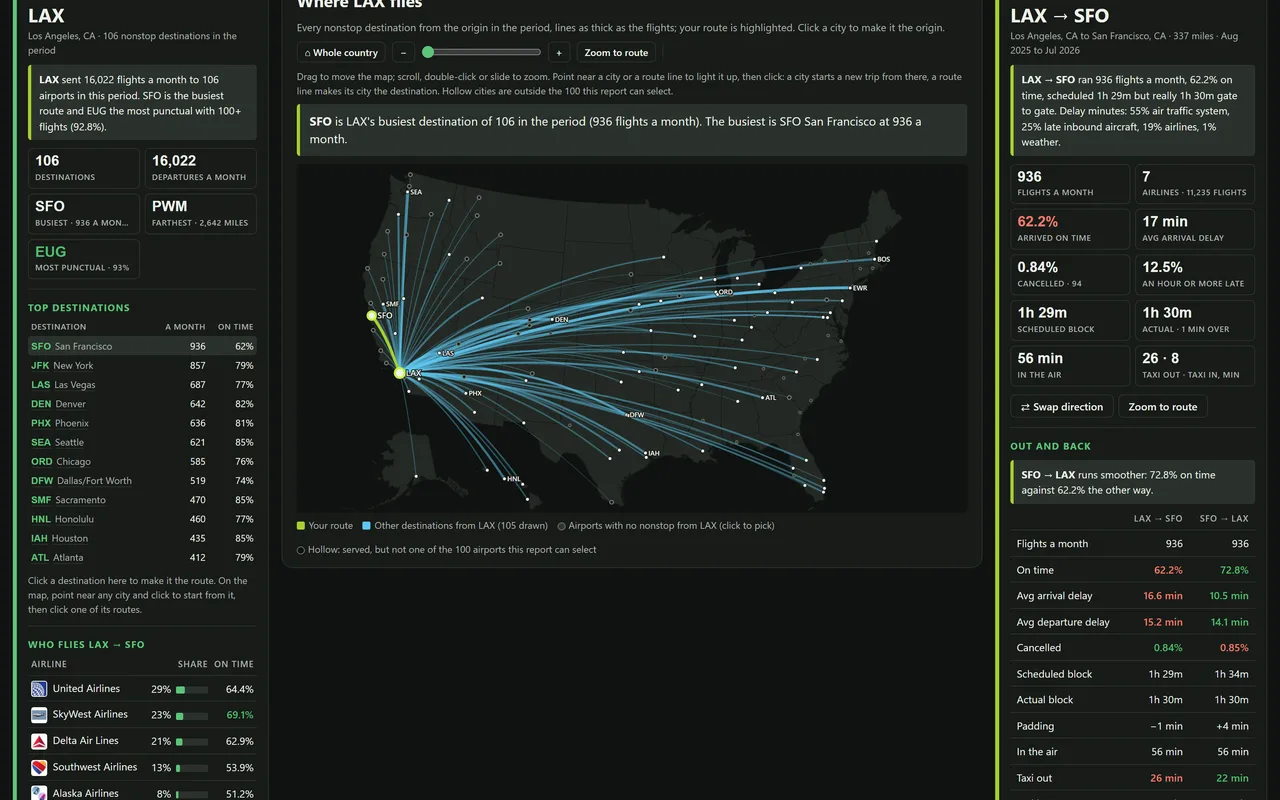 Route ExplorerPick any two of the 100 busiest airports on a zoomable map: the route’s numbers, the airlines flying it, both directions, alternatives, its best hour and weekday, and its history back to 1987.
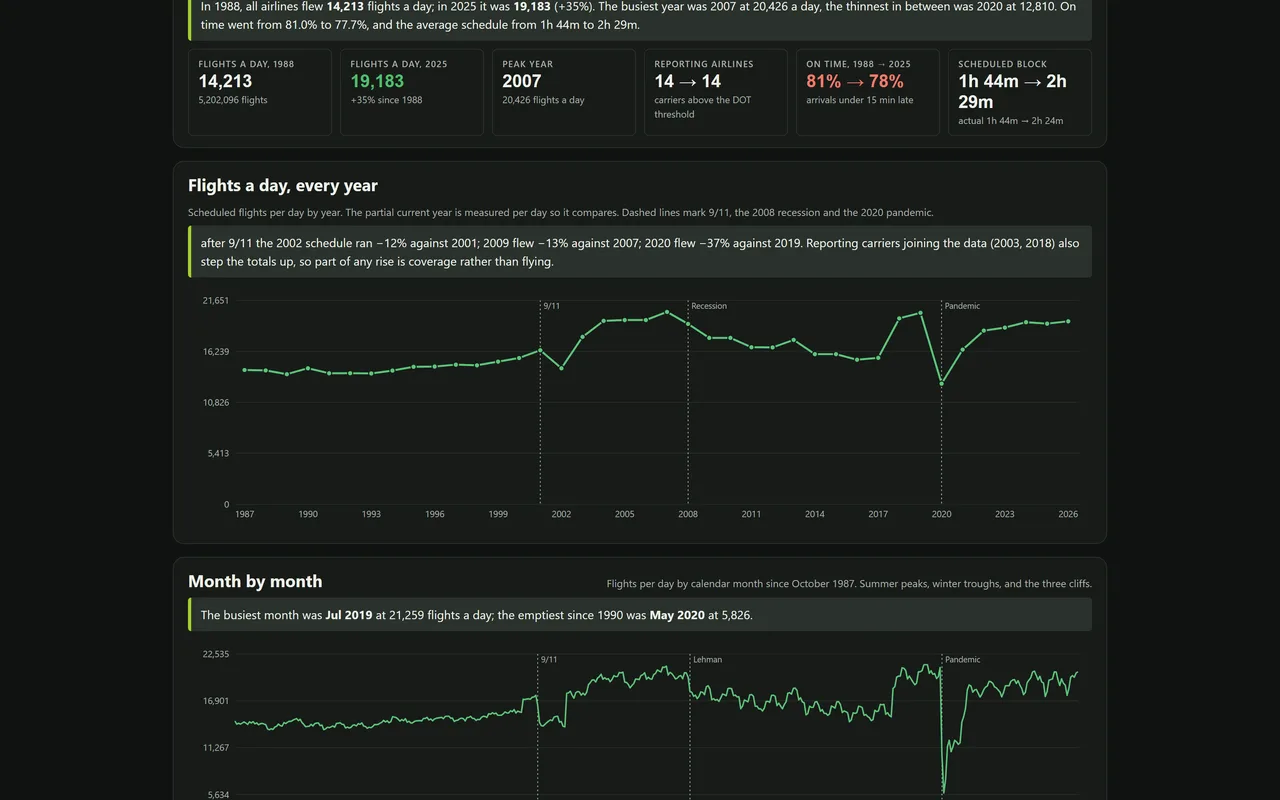 How Flying ChangedThirty-nine years of US air travel: flights, airlines, punctuality, schedule padding, aircraft size and age, taxi times and the worst days, year by year since October 1987.
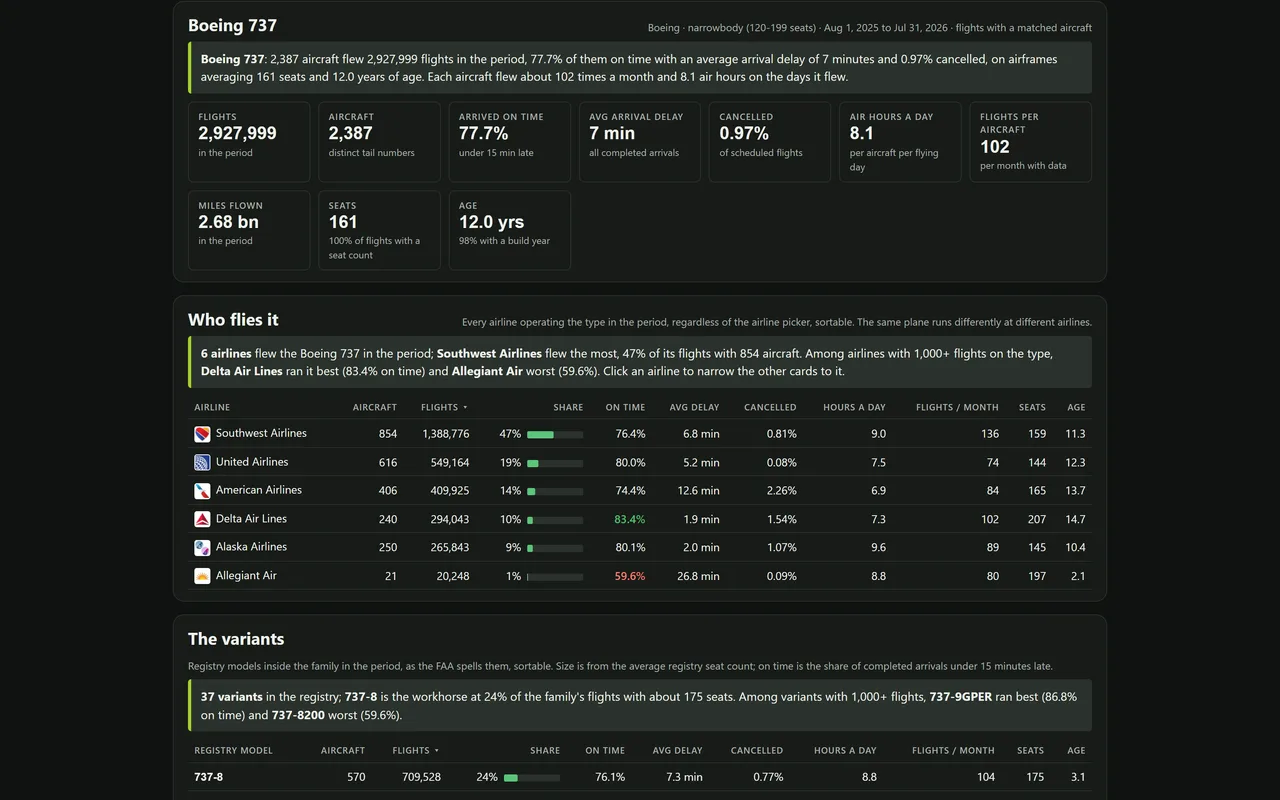 Aircraft ReportPick one aircraft type: its punctuality, variants, the airlines flying it, its history since 1995, whether its older airframes run later, its hardest-working tails, and how it compares with every other type.
Questions answered
- Which US airline is the most on time?Delta, among the airlines you can still book: 81.5% of its 1.04 million flights in the twelve months to July 2026 arrived on time, ahead of United (79.3%), Alaska (79.6%), Southwest (76.4%) and American (74.6%). JetBlue (72.3%), Spirit (72.8%) and Frontier (73.1%) were last. Hawaiian scored higher at 81.9% but stopped reporting separately in December 2025. The industry as a whole arrived on time 77.6% of the time and cancelled 1.8% of 7.0 million flights.
- Which US airport has the worst delays?Dallas Love Field for leaving late: only 68.3% of its departures pushed back on time in the twelve months to July 2026, then Fort Lauderdale (70.0%), Dallas/Fort Worth (71.1%), Chicago Midway (71.8%) and Nashville (72.1%). San Francisco is the worst place to arrive, 68.0% on time, because of fog and a single-runway arrival flow. Salt Lake City is the best large airport at both ends, 84.7% of departures and 85.0% of arrivals on time, and Chicago O’Hare is the busiest in the country at 986 departures a day.
- What is the best time of day to fly to avoid delays?The first flight of the morning. Flights scheduled to leave between 5 and 7 AM arrived on time 91.7%, 90.2% and 87.5% of the time in the twelve months to July 2026, and the 5 AM departures arrived three and a half minutes early on average. On-time rates then fall by roughly two points an hour all day to 67.7% for 8 PM departures, because two-thirds of the delay minutes in the evening are charged to the aircraft arriving late from its previous flight. Tuesday and Wednesday are the best days (81.4% and 81.1%), Sunday the worst (73.6%); September is the best month (83.4%) and July the worst (71.7%).
- What are the busiest flight routes in America?LaGuardia to Chicago O’Hare, with 23,222 flights in the twelve months to July 2026 counting both directions, 64 a day. Los Angeles to San Francisco (22,470) and JFK to Los Angeles (20,565) are next, then the Honolulu to Maui shuttle (20,147), Boston to Washington National (18,182) and Denver to Phoenix (17,917). The busiest routes are also among the least punctual: LaGuardia to O’Hare arrived on time 67.7% of the time and Los Angeles to San Francisco 67.5%, against 77.6% for all flights, and San Diego to San Francisco is the worst high-volume route in the country at 63.7%.
- How has air travel in America changed since 1987?There are a third more flights a day than in 1988 (19,183 against 14,213 in 2025), flown by fewer airlines, on planes that average 158 seats instead of 142 and are 13 years old instead of 10. The flights are 150 miles longer on average, the schedules allow five minutes more than the trip takes where they once allowed none, and the aircraft spends five minutes longer taxiing. Punctuality has not improved: 77.7% of flights arrived on time in 2025 against 81.0% in 1988, and the 1990s, 2002-03 and 2009-12 were all better than today.
- Which aircraft types are the most reliable?The Boeing 717, if reliable means arriving on time: 84.4% of its 181,664 flights in the twelve months to July 2026 arrived on time, the best of any type with a real fleet, then the Embraer 175 (80.7% over 1.03 million flights). The Boeing 737, which flew 2.93 million flights on 2,387 aircraft, 42% of all matched flights, managed 77.7%, the Airbus A321 76.4% and the A320 75.3%; the 50-seat and 70-seat Bombardier regional jets were last at 74.0% and 73.4%. Age does not show up in punctuality at all: aircraft over 25 years old arrived on time 77.9% of the time, new ones 77.4%.
Why this exists
Most demos are recordings. This one talks back.
Every report above runs on a governed semantic model, the same kind we build for clients. The difference is that these hold public data, so we can leave the door open. You can change the filters and ask the model a question nobody wrote a chart for – which is the part no screenshot has ever managed to show.
Bring us your hardest question.
Your white whale: you know there has to be a better way, and if you could crack it, your world would change. We thrive on those.