Open data / Flights
US flight data, open to anyone.
Every domestic flight reported to the Bureau of Transportation Statistics since October 1987, 235 million of them, joined to the aircraft that flew them. Which airline, airport, hour, route and plane gets you there on time, and how all of it has changed over 39 years. Open a report, pick your period, or ask the model something nobody built a chart for.
Questions answered
- Which US airline is the most on time?Delta, among the airlines you can still book: 81.5% of its 1.04 million flights in the twelve months to July 2026 arrived on time, ahead of United (79.3%), Alaska (79.6%), Southwest (76.4%) and American (74.6%). JetBlue (72.3%), Spirit (72.8%) and Frontier (73.1%) were last. Hawaiian scored higher at 81.9% but stopped reporting separately in December 2025. The industry as a whole arrived on time 77.6% of the time and cancelled 1.8% of 7.0 million flights.
- Which US airport has the worst delays?Dallas Love Field for leaving late: only 68.3% of its departures pushed back on time in the twelve months to July 2026, then Fort Lauderdale (70.0%), Dallas/Fort Worth (71.1%), Chicago Midway (71.8%) and Nashville (72.1%). San Francisco is the worst place to arrive, 68.0% on time, because of fog and a single-runway arrival flow. Salt Lake City is the best large airport at both ends, 84.7% of departures and 85.0% of arrivals on time, and Chicago O’Hare is the busiest in the country at 986 departures a day.
- What is the best time of day to fly to avoid delays?The first flight of the morning. Flights scheduled to leave between 5 and 7 AM arrived on time 91.7%, 90.2% and 87.5% of the time in the twelve months to July 2026, and the 5 AM departures arrived three and a half minutes early on average. On-time rates then fall by roughly two points an hour all day to 67.7% for 8 PM departures, because two-thirds of the delay minutes in the evening are charged to the aircraft arriving late from its previous flight. Tuesday and Wednesday are the best days (81.4% and 81.1%), Sunday the worst (73.6%); September is the best month (83.4%) and July the worst (71.7%).
- What are the busiest flight routes in America?LaGuardia to Chicago O’Hare, with 23,222 flights in the twelve months to July 2026 counting both directions, 64 a day. Los Angeles to San Francisco (22,470) and JFK to Los Angeles (20,565) are next, then the Honolulu to Maui shuttle (20,147), Boston to Washington National (18,182) and Denver to Phoenix (17,917). The busiest routes are also among the least punctual: LaGuardia to O’Hare arrived on time 67.7% of the time and Los Angeles to San Francisco 67.5%, against 77.6% for all flights, and San Diego to San Francisco is the worst high-volume route in the country at 63.7%.
- How has air travel in America changed since 1987?There are a third more flights a day than in 1988 (19,183 against 14,213 in 2025), flown by fewer airlines, on planes that average 158 seats instead of 142 and are 13 years old instead of 10. The flights are 150 miles longer on average, the schedules allow five minutes more than the trip takes where they once allowed none, and the aircraft spends five minutes longer taxiing. Punctuality has not improved: 77.7% of flights arrived on time in 2025 against 81.0% in 1988, and the 1990s, 2002-03 and 2009-12 were all better than today.
- Which aircraft types are the most reliable?The Boeing 717, if reliable means arriving on time: 84.4% of its 181,664 flights in the twelve months to July 2026 arrived on time, the best of any type with a real fleet, then the Embraer 175 (80.7% over 1.03 million flights). The Boeing 737, which flew 2.93 million flights on 2,387 aircraft, 42% of all matched flights, managed 77.7%, the Airbus A321 76.4% and the A320 75.3%; the 50-seat and 70-seat Bombardier regional jets were last at 74.0% and 73.4%. Age does not show up in punctuality at all: aircraft over 25 years old arrived on time 77.9% of the time, new ones 77.4%.
The data
Each of these is a governed model, free to use and free to check: the sources are public, the joins are described on every page that draws on them, and the live report runs the same model the numbers came from.
US domestic flights and on-time performance, 1987 to present
Every scheduled domestic flight by airlines above the DOT reporting threshold from October 1987 to the latest month published: airline, origin, destination, scheduled and actual times, taxi and air time, cancellations and diversions, and the airline-coded delay causes and cancellation reasons reported since June 2003. Flights from 1995 carry a tail number joined to the FAA aircraft registry for manufacturer, model, seats and build year. 235 million flights, 34 airlines, 441 airports, 17,000 aircraft.
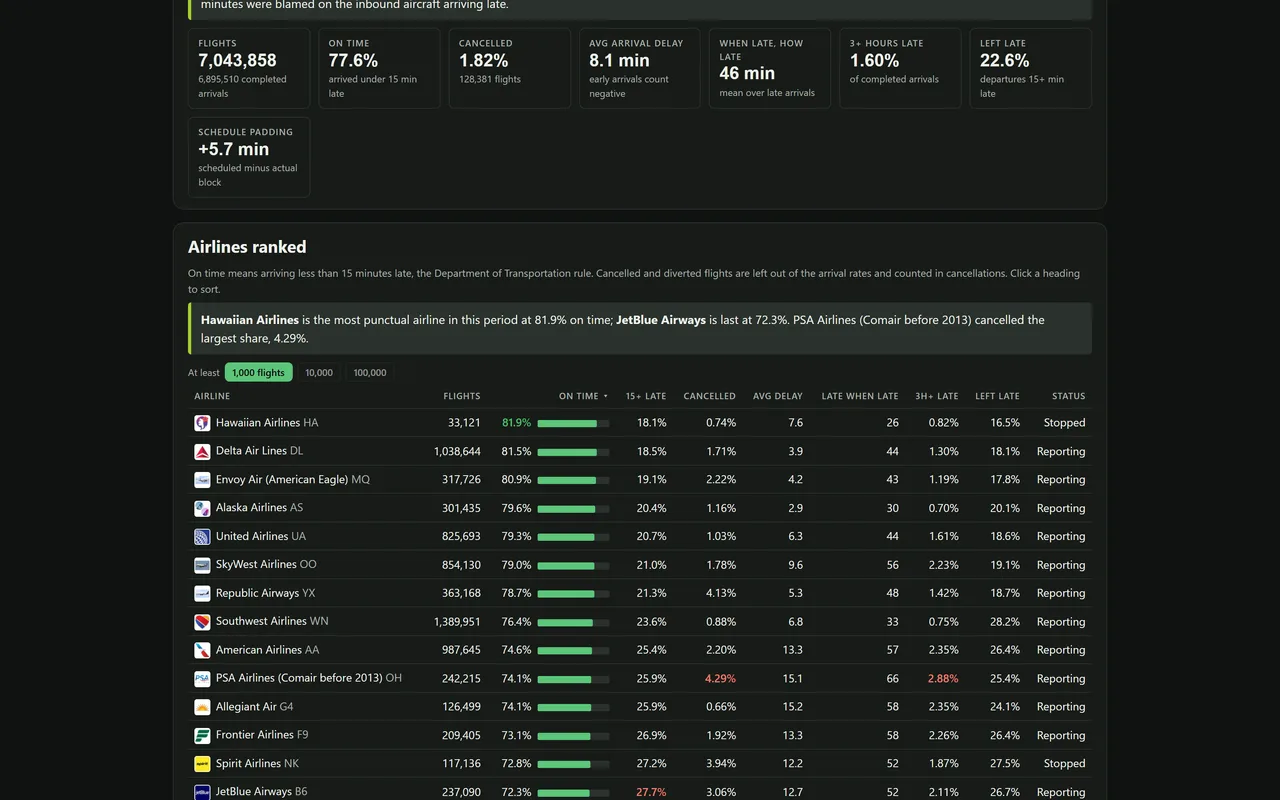 Airline ScorecardEvery airline ranked on on-time arrivals, cancellations, severe delays, delay causes and schedule padding for any period since 1987, with the airlines that no longer exist.
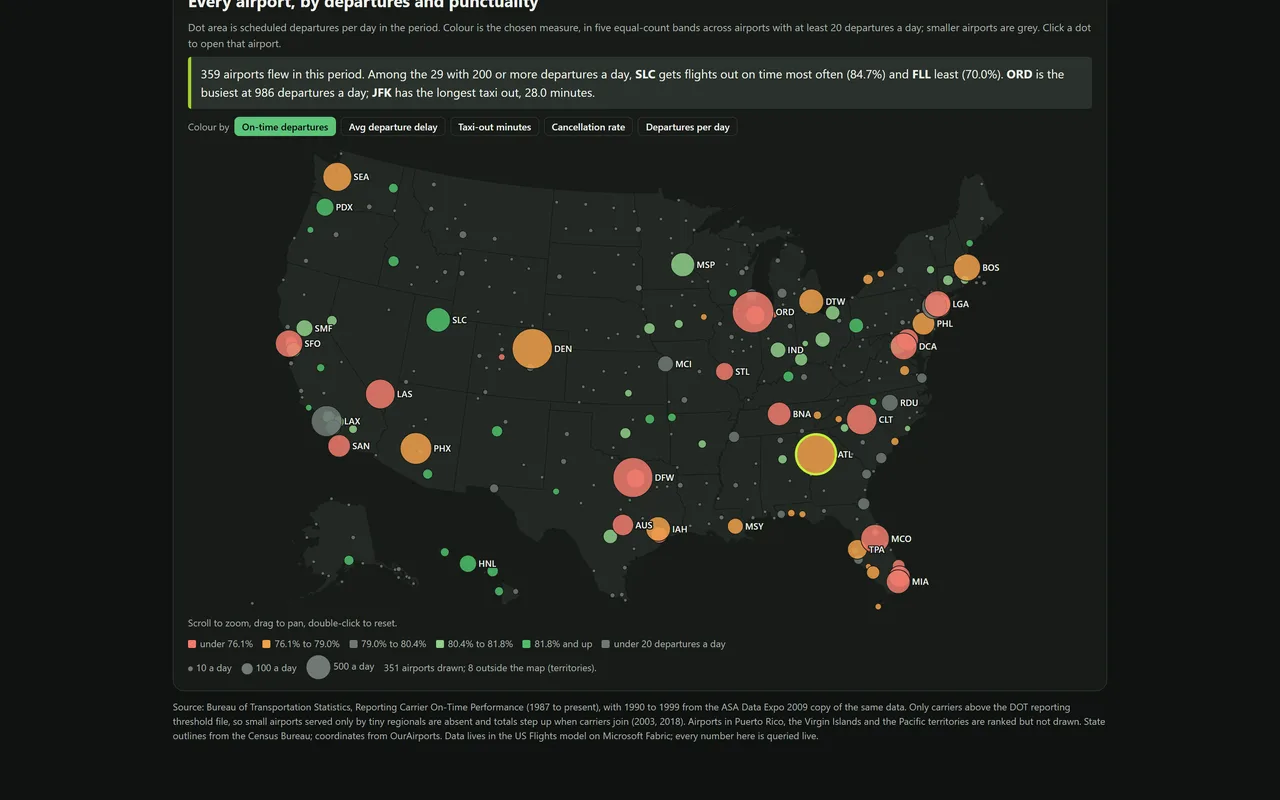 Airport ReportEvery US airport on a map sized by departures, rankings on punctuality, taxi time and delay causes, the hubs that grew or emptied, and one airport’s page of months, years, airlines and destinations.
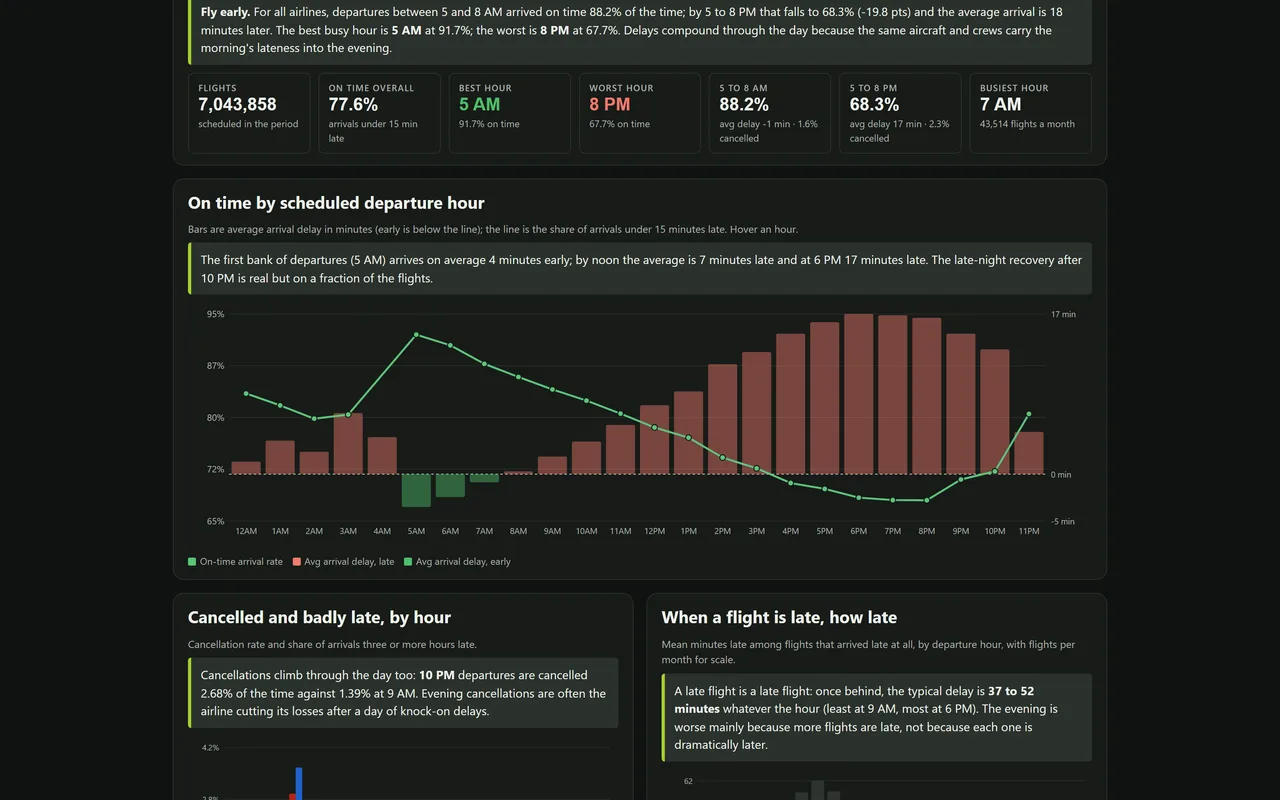 When to FlyThe best departure hour, weekday, month and week to fly, why delays pile up through the day, holiday weeks, and how late is late, for any airline and period.
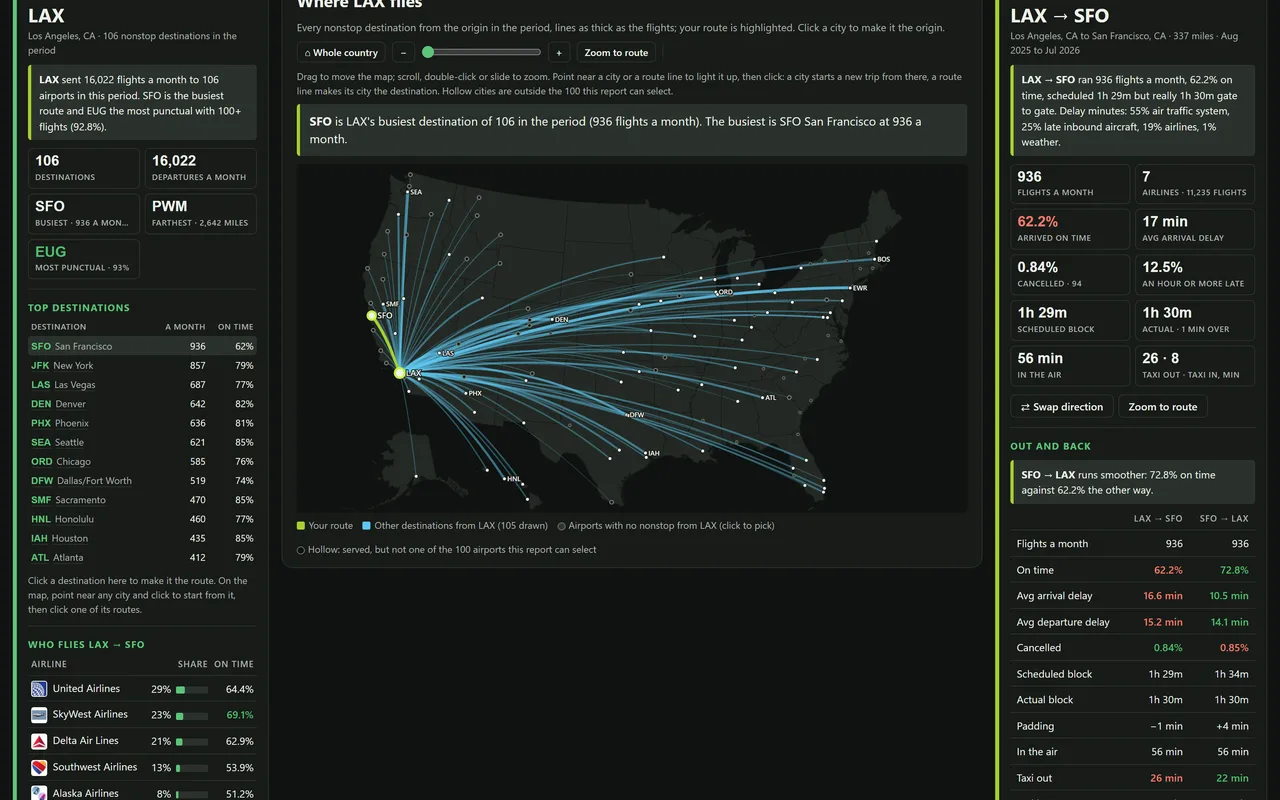 Route ExplorerPick any two of the 100 busiest airports on a zoomable map: the route’s numbers, the airlines flying it, both directions, alternatives, its best hour and weekday, and its history back to 1987.
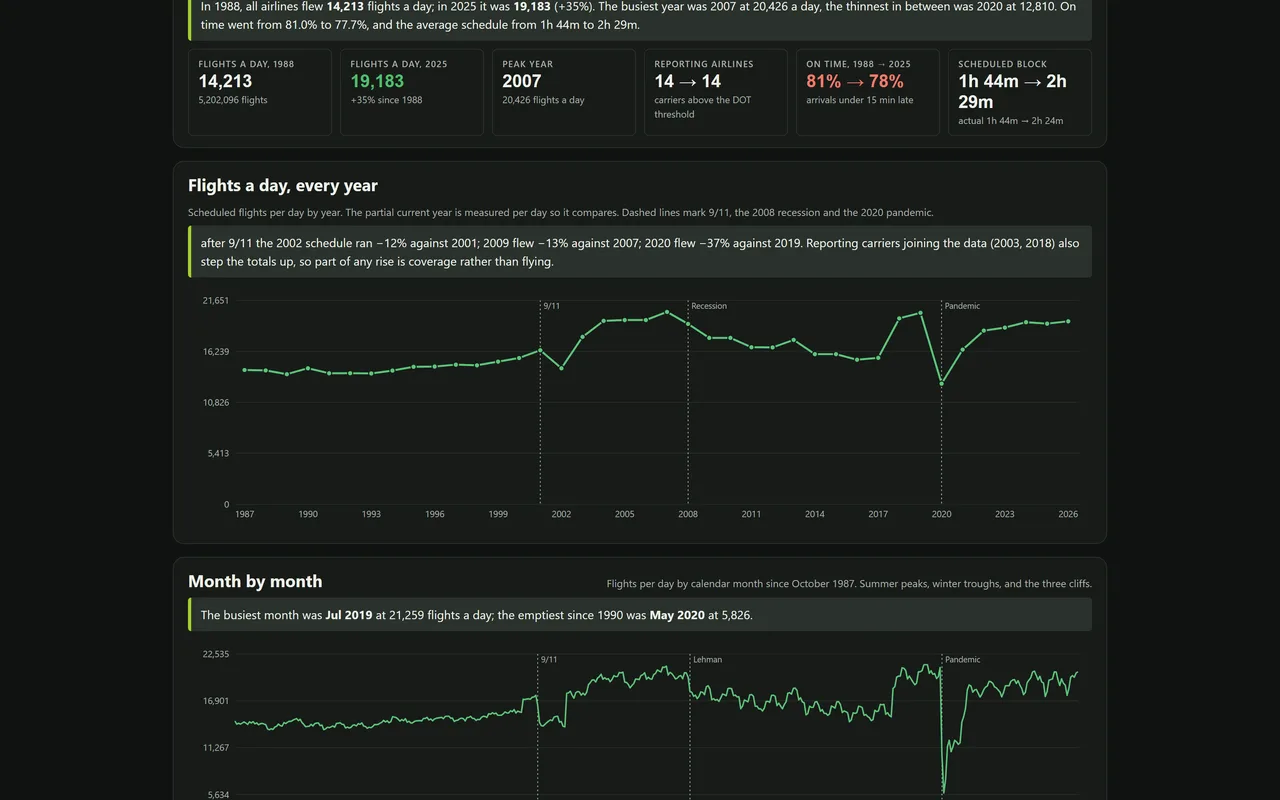 How Flying ChangedThirty-nine years of US air travel: flights, airlines, punctuality, schedule padding, aircraft size and age, taxi times and the worst days, year by year since October 1987.
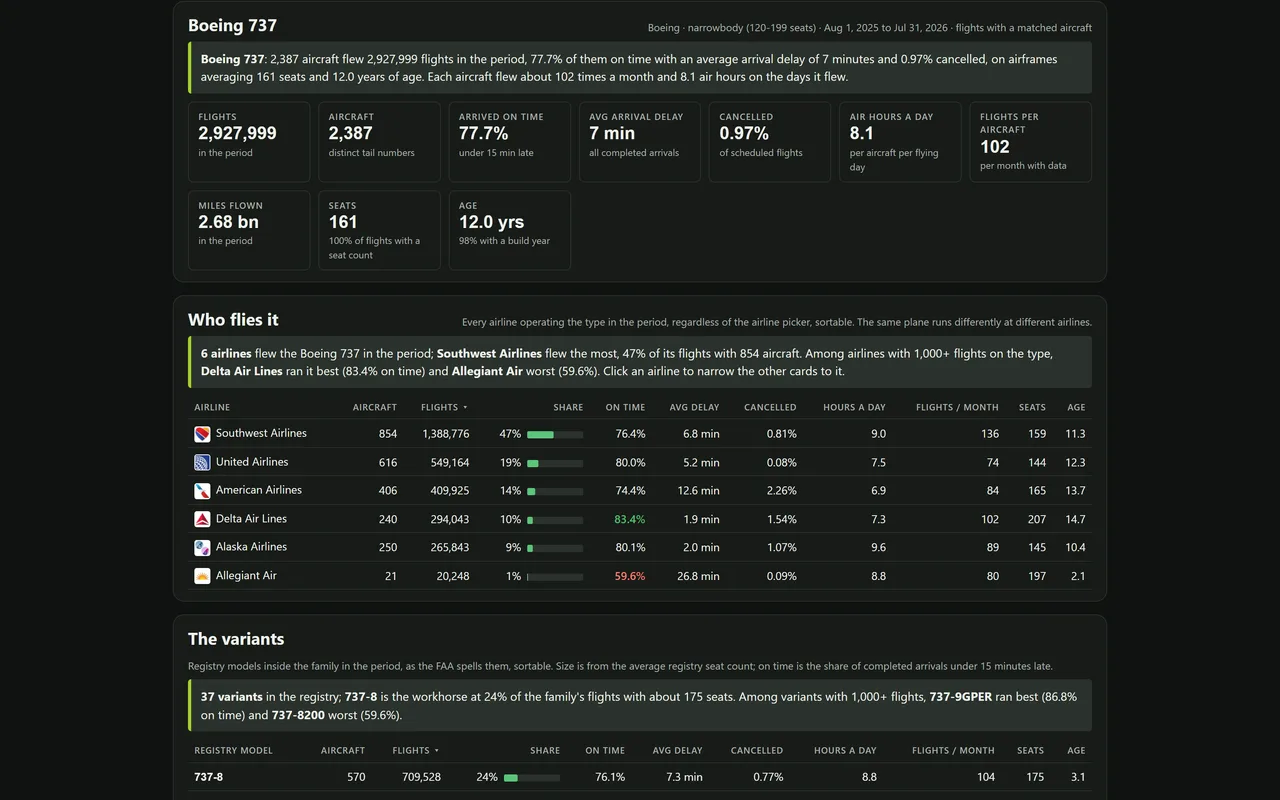 Aircraft ReportPick one aircraft type: its punctuality, variants, the airlines flying it, its history since 1995, whether its older airframes run later, its hardest-working tails, and how it compares with every other type.
Bring us your hardest question.
Your white whale: you know there has to be a better way, and if you could crack it, your world would change. We thrive on those.