Open data / Housing
Housing and migration data, open to anyone.
Where Americans move, what a home costs where they land, and whether the two are connected: IRS migration returns and Zillow home values for every county, joined so the question can be asked. Open a report, pick your years and your county, or ask the model something nobody built a chart for.
Questions answered
- Where are Americans moving?South, and to the suburbs. In the 2023 migration year Texas gained a net 112,481 people from other states and Florida 111,742, with South Carolina (11.0 per 1,000 residents) and North Carolina growing fastest for their size; California lost 200,547 and New York 157,970, the steepest rate in the country at 8.0 per 1,000. The single biggest move was California to Texas, 44,417 households. Since 2012 Florida has gained 1.75 million people and 224 billion dollars of income from other states while New York has lost 2.0 million people, and the fastest-growing counties are exurbs of Dallas, Houston, Orlando and Wilmington rather than the big cities themselves.
- How much does a home cost in America?The typical home in the median state was worth 350,800 dollars in August 2026, from 833,300 in Hawaii and 764,200 in California down to 179,500 in West Virginia. Values have risen 23% in the median state since August 2021, most in Connecticut (40%), New Hampshire (36%) and New Jersey (35%), and have fallen in only one place, the District of Columbia (−10%). San Jose is the most expensive metro at 1.54 million dollars and McAllen, Texas the cheapest big one at 193,000; against local incomes, Los Angeles is the least affordable, 18.6 years of the median household’s income, and Pittsburgh the most, 4.3. Rent runs from 2,996 dollars a month in Hawaii to 1,167 in Iowa.
- Do movers push up home prices?Mostly yes, with loud exceptions. Across the 50 states and DC, net migration per 1,000 residents over 2020 to 2023 and the change in typical home value from January 2020 to December 2023 correlate at 0.74: Idaho gained 53 people per 1,000 and its homes rose 54%, Montana 38 and 61%, Florida 35 and 59%, while the District of Columbia lost 61 per 1,000 and rose 6%. At county level the link is weaker (0.43) but holds: counties gaining 40 or more per 1,000 rose a median 50%, counties losing 10 or more a median 34%. The exceptions are where the story is: Miami-Dade lost 49 people per 1,000 and rose 61%, and Austin’s Travis County lost people every year from 2020 while prices rose 32% in 2021 and then fell 8% in 2023.
The data
Each of these is a governed model, free to use and free to check: the sources are public, the joins are described on every page that draws on them, and the live report runs the same model the numbers came from.
US county-to-county migration from IRS returns, 2012 to 2023
Every county-to-county and state-to-state flow of tax returns in the IRS Statistics of Income migration data, 2012 to 2023, with the households, people and adjusted gross income that moved, each county's and state's yearly totals, non-migrant households and income, foreign arrivals, and Census Bureau population for rates per 1,000 residents, with metro areas and planning regions resolved.
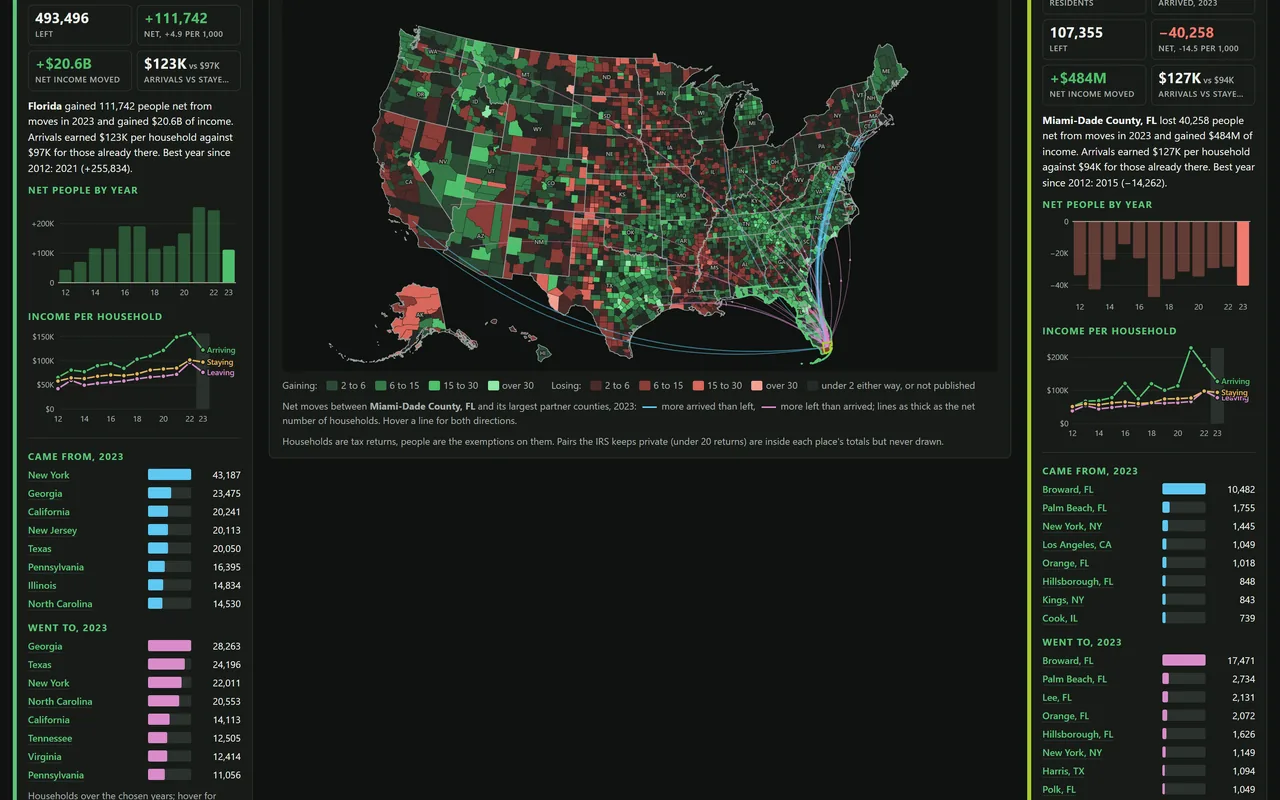
US home values and rents by county from Zillow, 2000 to present, with IRS income and migration
Zillow's typical home value for every US county, metro and state by month from January 2000, and typical rent from 2015 where Zillow publishes it, joined to the median adjusted gross income of households filing from each area (IRS, 2013 to 2023) and to the IRS migration data, so prices can be set against local incomes and against who moved in and out.
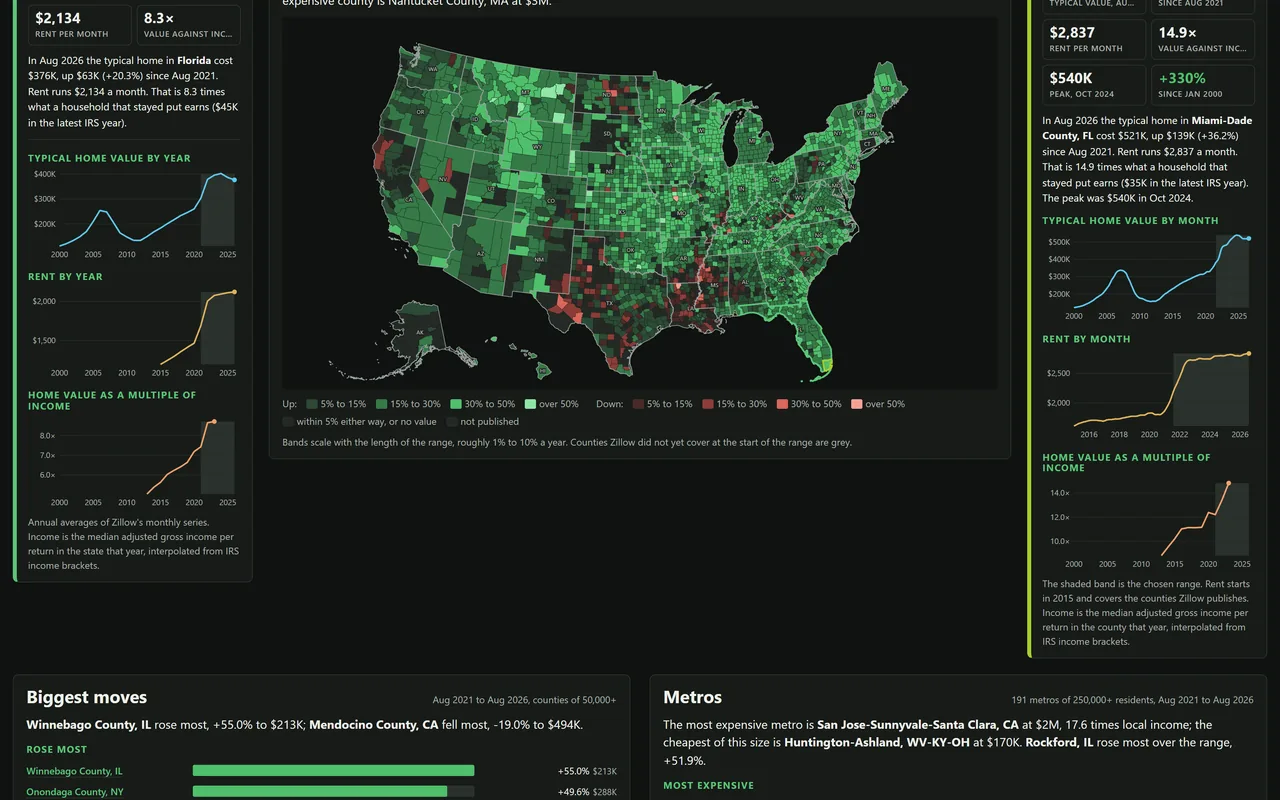 What a Home CostsA pan-and-zoom map of typical home values, their change or their ratio to local income for any two months, the open state and county with monthly history, and the biggest risers and fallers among counties, metros and states.
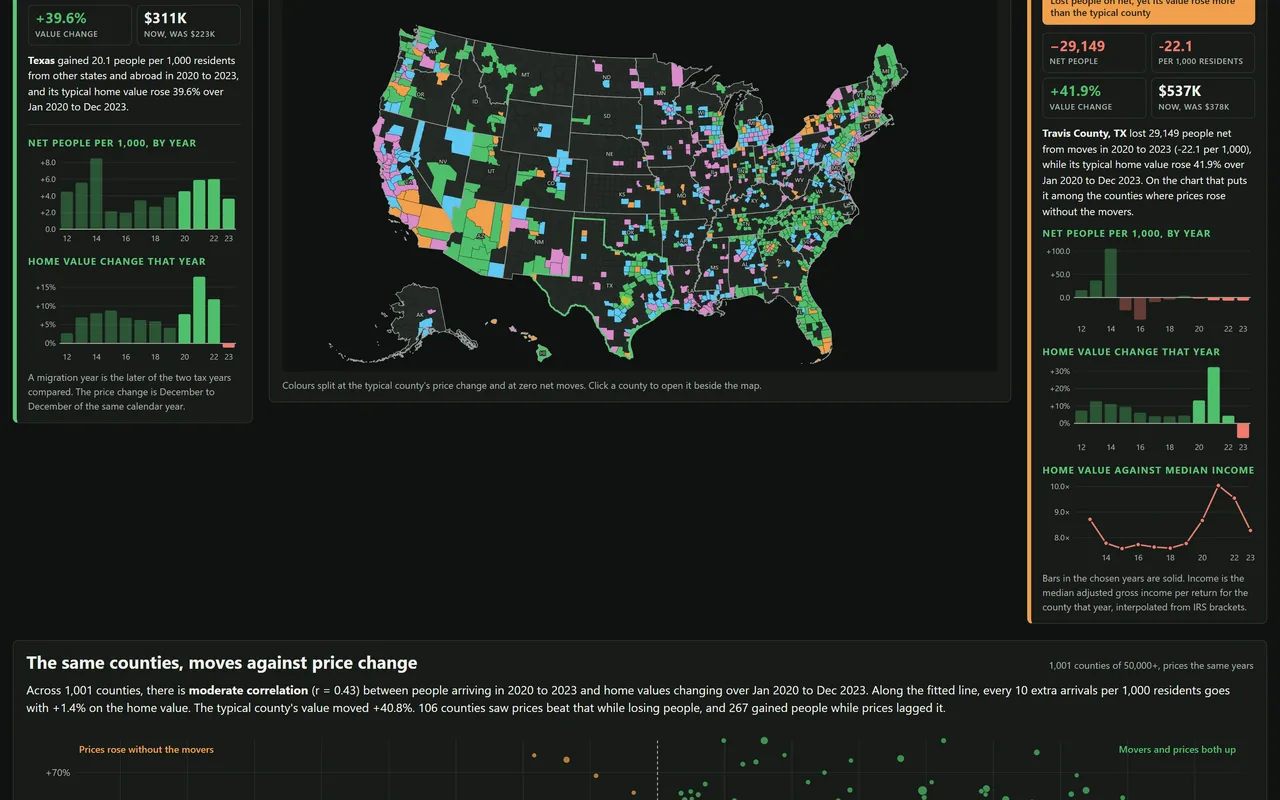 Did the Movers Push Prices Up?Every county's net migration set against its home-value change over the same years: a scatter with a fitted line and correlation, a map coloured by quadrant, and the counties where prices rose without arrivals and arrivals did not move prices. Year range, lag and population floor are selectable.
- How much does a home cost in America?
- Do movers push up home prices?
Bring us your hardest question.
Your white whale: you know there has to be a better way, and if you could crack it, your world would change. We thrive on those.