
DAX – What is Driving my Sales $ Increase?
I LOVE Pivot Tables – they are (in my view) the best aggregation tool available to the data analyst today
I LOVE Pivot Tables – they are (in my view) the best aggregation tool available to the data analyst today

Folks, today I want to share a source of personal pride – literally share it, and make sure YOU experience it
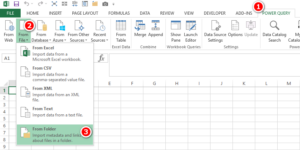
Today I am sharing how I use Power Query as a file audit tool to support a regular task I complete every week. The objective of this post is to create broader awareness of how great Power Query is to solve different types of problems, and to possibly get you thinking about other problems you have that could be solved with this tool.
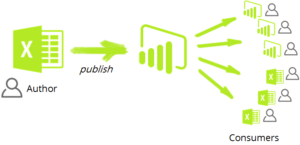
Recorded a brief demo video of this feature, embedded below. Analyze in Excel is reported to be working for some free accounts but not all (does not work for me). Does work for Paid/Pro accounts. If you use multiple accounts you may need this workaround.
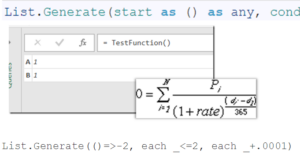
An article that includes a simple tutorial on how to create tables in Power BI with M written by the experts at P3 Adaptive.
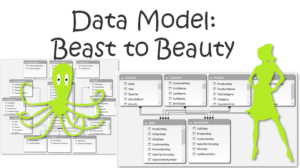
An article on Data Modeling for Power Pivot and Power BI as well as a brief explanation about what we do written by the experts at P3 Adaptive .
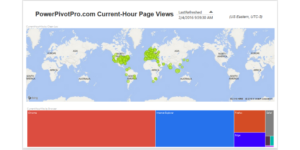
An article on what is possible with an embedded Power BI dashboard and Google Analytics from the experts at P3 Adaptive .

Over the last 12 months I have engaged with may people from lots of different companies on the topic of Power Pivot.
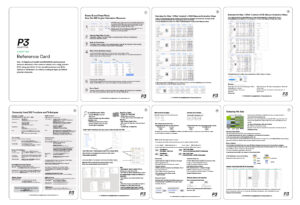
A long time coming… The Finalized 8-Page “Reference Card V2” – Download it for Free Below Yes, this took me forever. I first posted about it more than

Director of Product Management, Microsoft BI
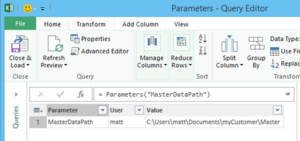
The concept of parameter tables in Power Query will be familiar to some and new to others. A parameter table is a way that you can “pass” values to Power Query (and also Power Pivot) and these values can then be used in your queries and/or the data model.

Post by Rob Collie First, a Few Quick Updates…