SQL Rockstar, aka Tom LaRock (Blog | Twitter) sent me a fascinating data set the other day: a table of different computing devices over the years, their “horsepower” in calculations per second, and how much they cost:
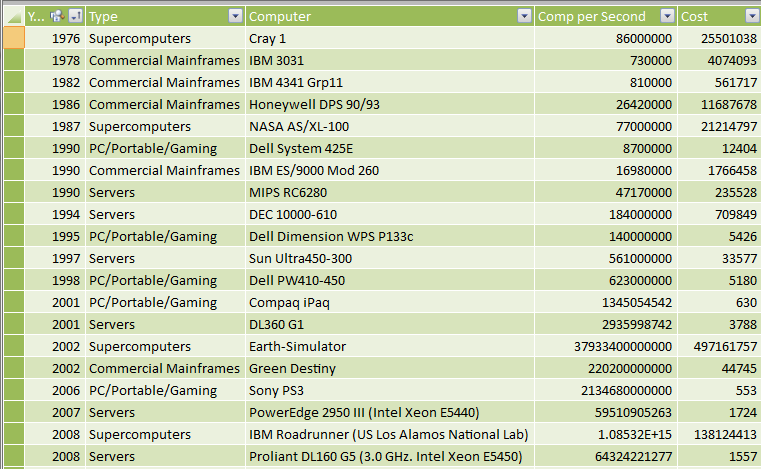
Source: The Rise of the Machines
The Cost of a Million Calcs per Second, Over History
Tom remarked that some modern devices, like his iPad2, have more computing power per dollar than even some of the recent supercomputers.
To validate this, I added a calc column called “Cost per MCalc”
=Computers[Cost]/(Computers[Comp per Second]/1000000)
And indeed, his iPad2 is cheaper per million calcs than, say, 2002’s Earth Simulator:

By a lot, too. Like 40x cheaper per MCalc.
But then he had an astute follow-on question: how would that change if we took inflation into account? That’s when he tagged me in.
Enter Shadowstats!
Tom’s idea finally gave me an excuse to subscribe to Shadowstats.com. About six months ago I even emailed them and asked them whether they had considered setting themselves up on Azure Datamarket. (Their answer: not yet. My answer: I’ll be back to convince you later.)
Shadowstats provides historical data on things like inflation and employment, and provides it in a convenient format (which is in itself quite valuable – have you ever tried to make sense of the data from .gov sites? It’s a labyrinthine mess.)
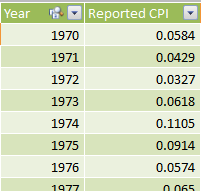
Into PowerPivot as a New Table
Wow, 11% inflation in the US in 1974, my birth year? Wow. That’s intense. And it piles up quickly when you have a few years in a row of high inflation.
Cumulative Impact of Inflation
To measure cumulative impact, I added a new column:
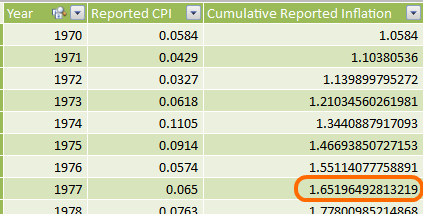
What that shows us is this: Prices were 65% higher at the end of 1977 than they were at the beginning of 1970. A 65% increase in the cost of living in just eight years.
Let’s chart it:
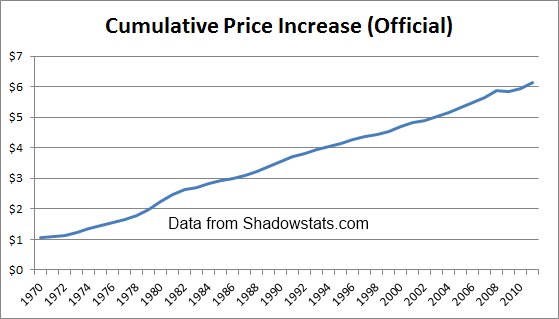
(Official US Govt Numbers)
Factoring Inflation Into Price per MCalc: 2011 Adjustment Factor
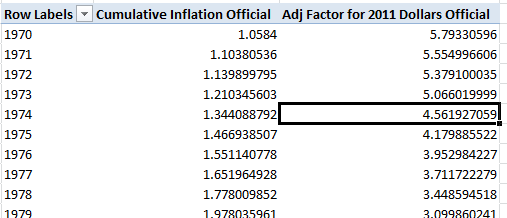
Tom wanted to convert everything into 2011 dollars, which makes sense. In order to do that, I created two measures. Cumulative Inflation Official is just the Average of the same column in the CPI table of my source data, and the Adj Factor is:
=CALCULATE([Cumulative Inflation Official], Years[Year]=2011)
/ [Cumulative Inflation Official]
In other words “take the Cumulative Inflation value for 2011 and divide it by the Cumulative Inflation value for the current year.”
Now I can use that factor to give me a 2011-Adjusted cost per MCalc:
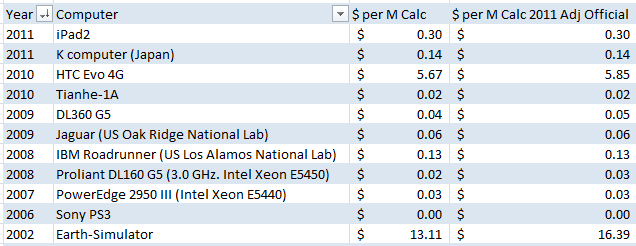
Where that second measure is just:
=[$ per M Calc]*[Adj Factor for 2011 Dollars Official]
Which shows us that the iPad2 is an even better deal (in terms of MCalc’s), compared to the Earth Simulator, than we had originally thought – more like 50x cheaper as opposed to our original 40x cheaper.
What’s with the Playstation3?
It rounds to $0.00 per MCalc even when adjusted to 2011 dollars? I know game systems are sold at a loss, but really? Well, the Playstation IS the only gaming/graphics system in the data, and those are of course dedicated renderers of polygons, and NOT general-purpose calcs. So the number is indeed a lot higher – gaming systems just offer an insane number of (polygon) calcs per second, which is why there is so much interest these days in using GPU’s for business calc purposes – if you can “transform” a biz problem into a polygon problem, you’re off to the races.
Tying it All Together
Here you go, the “final” results:
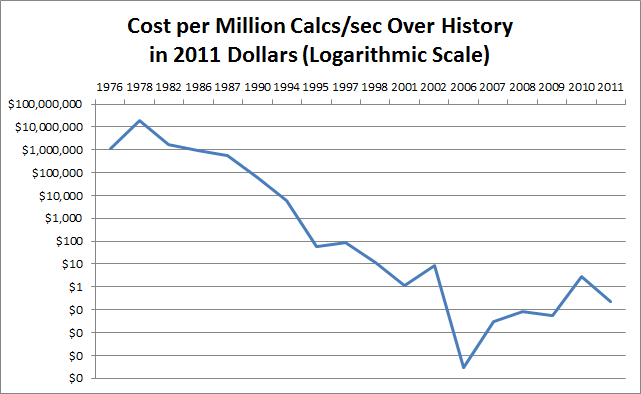
Why the heck does it go back UP????
Isn’t that interesting? We see a steady and sharp decline in price per MCalc from the 1970’s all the way into 2006, but then prices start to RISE again?
The data IS skewed a bit by the fact that we only are looking at 26 computers. So if we happened to have a supercomputer in the data in 2009 but no PC or server, that can throw us off.
Let’s take a look by type of computer, then:

(Click for Larger Version)
OK, the shapes are a bit different, and the 2006 “plunge” in price for PC/Gaming/Handheld IS indeed due to 2006 being the year where the PS3 shows up… but all three charts DO show some form of recent price increase per M Calcs.
So what’s going on? Our Quest for Power Meets Physics.
I’m no expert but I’ve read enough over time to have a decent idea what’s causing that rise.
For the most part over computing history, our quest hasn’t really been for “cheap.” It has been a quest for power. My Dell PC in 1992 was about $3,000 and offered 33 M Calcs. Five years later I bought a $2,500 machine that offered about 300 M Calcs. So in five years the price fell a little but the power grew a lot.
In theory, at that point I could have bought the 1992 level of power (33 MCalcs) for $300 or so. But that’s not what I did. I bought a more powerful machine rather than a cheaper machine. My roommates would have made fun of me. Conor lorded his fancy 3d graphics card over me every time we played Quake. I needed 300 MCalcs!
Moore’s Law is based on our ability to continually cram ever-more transistors onto a single chip. And as we’ve gotten closer and closer to the size of atoms, we’ve hit a bit of a limit in that regard. Moore’s Law is “stalling.”
When Moore’s Law stalls, do we stop chasing power? Nope, we just go in a different direction. We start going multi-core. Multi-CPU. And while that DOES deliver more MCalcs, at the moment, it’s a more expensive way of doing it than the old way of “keep shrinking the transistors.”
Next Up…
One of the REALLY cool things about PowerPivot is its “mashup” capability. I’ve shown it over and over. But now that I have a good source of inflation statistics, I can dollar-correct ANYTHING.
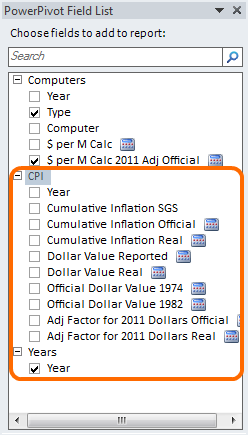
That is Associated with a Year or Date!
I’ll have another wrinkle to share about inflation later this week, and the hint is the difference between “official” and “real” inflation – you may even see some measures in the field list above.
Get in touch with a P3 team member