“Stay close! Come together! Staggered columns! Staggered columns!
I mean… less columns! More rows!”
-General Maximus Speedicus Queryus
A Long-Held Belief, Quantified
For a long time now I have been advocating that everyone minimize the number of columns in their large tables. For certain, you want to not import columns unless they are going to be used.
But I also recommend that if you have a lot of numerical columns in a table, it’s often better to replace them all with a SINGLE numerical column, and add a second column for “type.” Even though that results in many more rows, the theory is that PowerPivot’s VertiPaq engine would return quicker pivot results against the “tall, narrow” table than it would against the “short, wide” table.
I’ve simply “known” that to be true, in my bones, for a long time. I was so certain of it, in fact, that I have never bothered to test a “before and after” case until now.
We had an opportunity this weekend to quantify the “before” and “after” impact of making such a change, so I thought this time I’d record the results and share them.
The Original Data
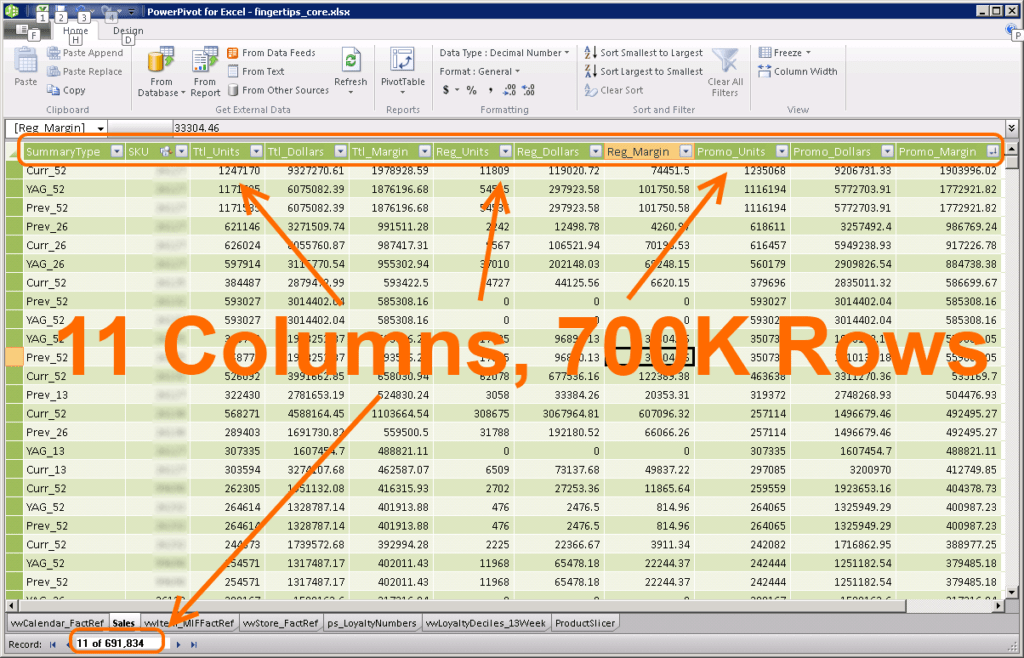
With that data shape, the [Sales] measure needs to be the sum of a specific column:
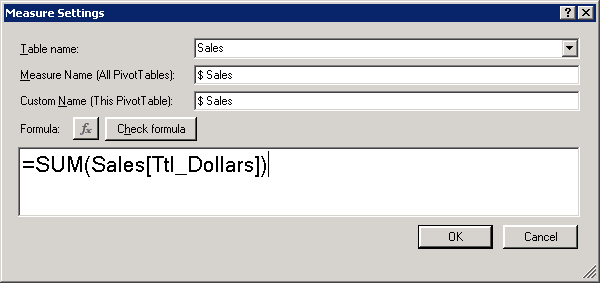
And then, a very large pivot reporting against this data ran in 5.7 seconds.
OK, so there’s our baseline.
The Taller, Narrower Table
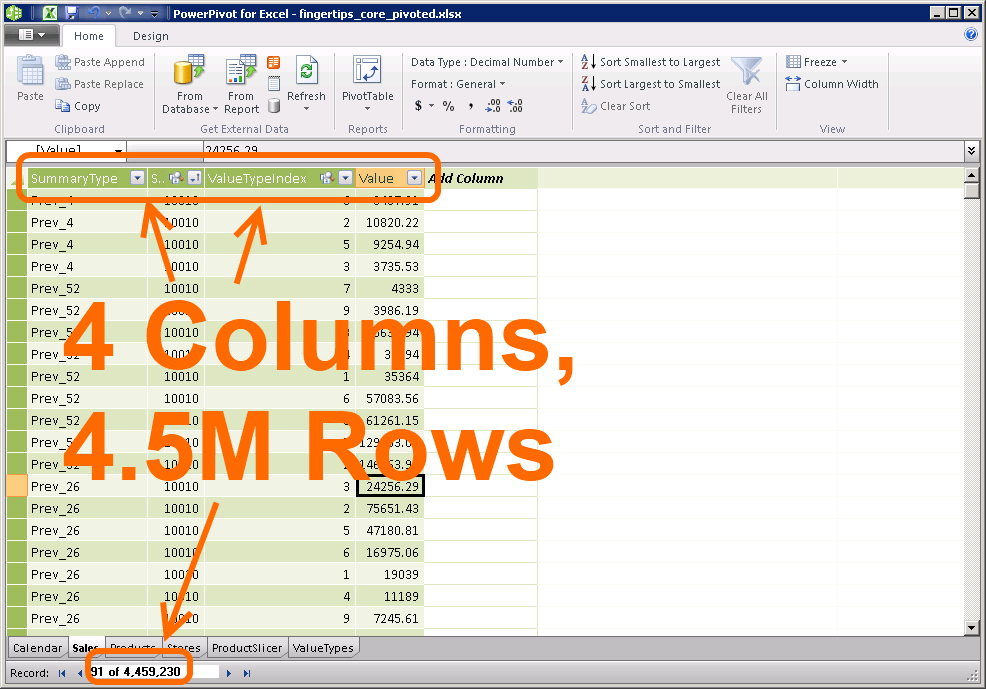
Whereas the original table used a single row to store all 9 numerical values, this new table stores each numerical value in its own row, and tags each row using the Value Type column to identify which numerical value it is.
(Note that in this new shape, zero values can be completely omitted if you’d like. And we did, which is why there are not 9 * 700k rows in the resulting narrow table – we just dropped rows that were going to be zeroes.)
I then added a very small table that “decodes” the ValueTypes into something I can understand, and related it to the tall table:
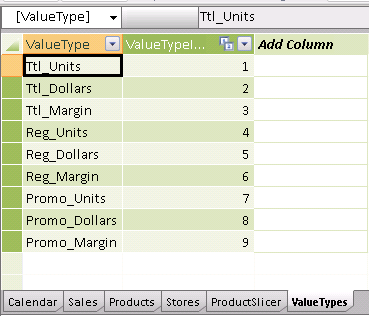
Lookup Table – Helps Write More Readable Measures
Each row in this lookup table corresponds to one of the original numerical columns in the Wide table, of course.
I then wrote a simple measure for [Amount]:
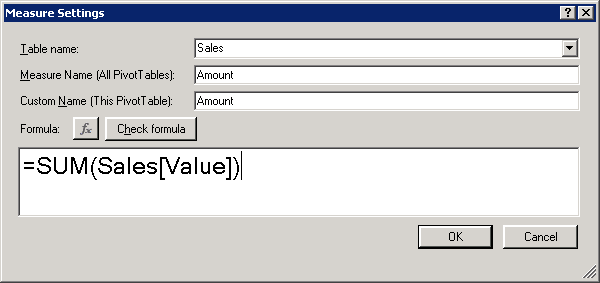
Base Measure – Just a Raw Sum of the Value Column,
Serves as a Basis for Other Measures
And then the Sales measure can simply be a filtered version of Amount:
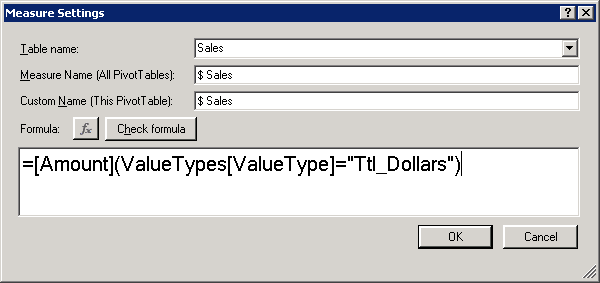
[$ Sales] = The [Amount] Measure Filtered to “Ttl_Dollars” Type Rows
The Results
I have to admit, I was a bit nervous, because I had colleagues watching me, they knew I was making a precise comparison and was going to share the results. Would this turn out as expected? Would it be faster? I experienced a moment of doubt as I was about to click the mouse and time the query. I mean, we were looking at nearly 7x as many rows in the new set. I was starting to sandbag my own expectations, telling myself it would likely be the same. I should not have doubted.
It ran in 2.4 seconds, more than twice as fast as the original 5.7 seconds.
Boom. It was worth it, big time. Even more impressive since there is definitely some fixed-cost overhead involved in Excel sending the query, populating the grid with thousands of rows of results, etc. There may even be a full second of overhead involved, in which case raw query time went from 4.7 to 1.4 seconds.
Why Faster? Will This ALWAYS Work?
Remember that VertiPaq is a COLUMN storage engine, and it compresses the data VERY efficiently. (I’ve covered this topic briefly here as well).
With that in mind, here are two quick answers. The long answers would be too long for this post
1) By removing a lot of the “noise” presented by the 9 numerical columns, this change enabled VertiPaq to do a much better job compressing the columns that remained. And that compression translates into better query speed as well.
2) No, I do NOT expect that this trick will always speed things up. It all comes down to “cardinality,” or how many unique values per column. And I’m pretty sure that the three columns dedicated to “Units” in the original data set had lower cardinality than the SKU column for instance. If we hadn’t had those Units columns, I suspect this change would NOT have been faster.
As a side note, the file size of tall and narrow was NOT smaller than short and wide. I’ve mentioned many times that file size is a ROUGH guide to performance but not 100%. Maybe we’ll discuss this in the comments section, because this post has run too long already.
No, I don’t think this will always work.
Get in touch with a P3 team member