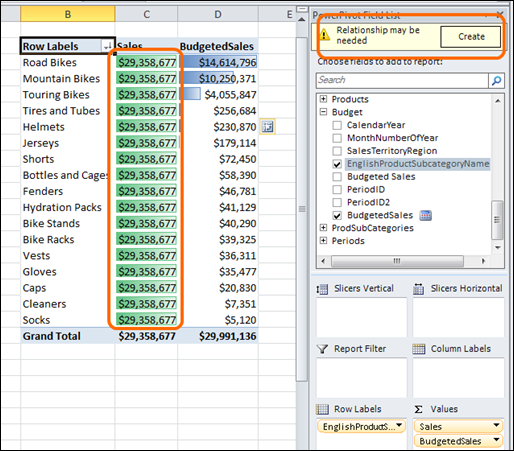
Sales Measure Returns the Same Value for Everything: We Solved the Calendar/Periods
Problem But Now We Have a Products/Category Problem
Quick Recap: We Created a Separate “Periods” Table
In last week’s post, I explained how PowerPivot can very easily help you solve the “Budget vs. Actuals” problem or any other problem where you have data sets of different granularities that you want to compare in a single report.
The crux of the problem in my example was that my Budget table only budgeted down to the Month level whereas my Sales table went down to the day level.
To solve that, I created a separate table that only contained months (no sales or budget data, just months), and assigned a “PeriodID” to each month. (I could have just as easily called it MonthId).
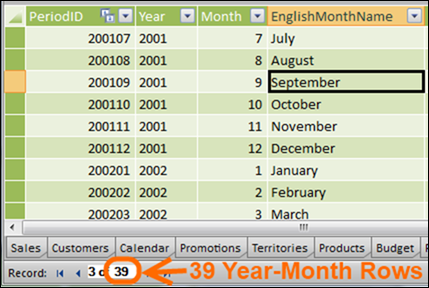
The Newly-Created Periods Table
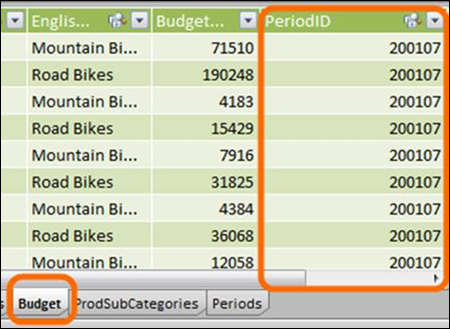
I then linked that PeriodID column to the PeriodID column that already existed in my Budget table:
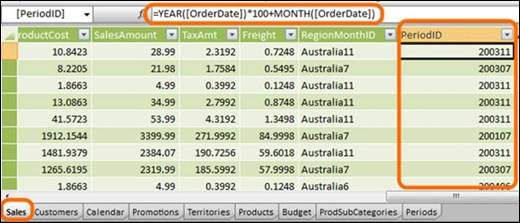
And then created a new PeriodID column in my Sales table using a formula:
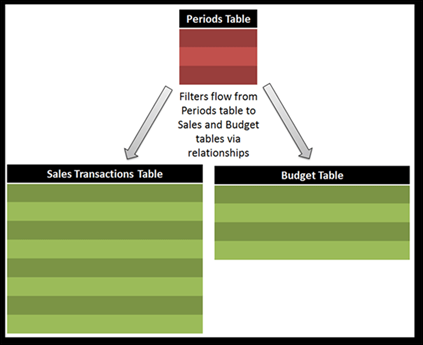
Resulting in a three-table setup that looks like this:
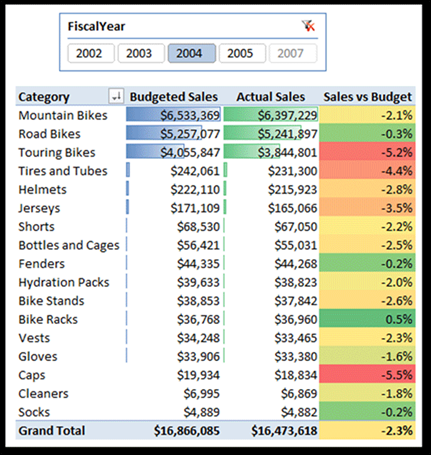
Which then allows me to use fields from that Periods table on slicers (or on rows or columns) while using measures from both Sales and Budget in the same pivot:
And that, my friends, is a very useful thing indeed.
Could I have just added the PeriodID column to Sales and Stopped?
This is an important question for us to stop and consider. Once I had a PeriodID column in both Sales and Budget, could I have skipped the creation of the Periods table and just moved on?
No. I could not. And there are two reasons.
Reason #1: I can’t create a relationship between Sales and Budget.
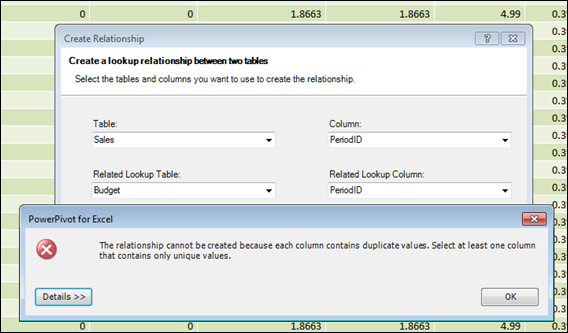
Each PeriodID Appears More than Once in Each Table, So You Can’t Relate
Sales Directly to Budget or Vice Versa
That’s just the way relationships work. The matching column needs to be unique (no value appears more than once) in at least one of the two tables. No need to really worry about why, but if you think about how VLOOKUP works when you set the last argument to FALSE, it’s pretty similar.
Reason #2: Without a relationship, PeriodID from one table doesn’t work with measures from the other.
Look what happens to Budget measures if I use PeriodID from the Sales table:
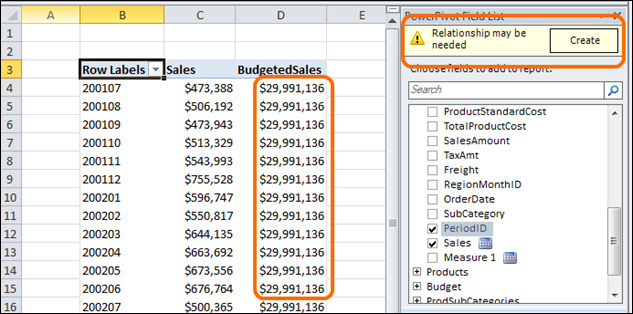
PeriodID from Sales Table Results in Broken Budget Measures
(and a relationship warning)
Yep, all busted. And if I use PeriodID from the Budget table, I’ll get good Budget numbers but the Sales numbers will be hosed instead.
THAT is why the third, new, separate Periods table is required. When I use fields from THAT table on my pivot, I can use measures from both Sales and Budget at the same time and nothing is broken.
So we use the Periods table as a master filter of sorts, one that can drive filters down into both Sales and Budget.
“Master Filter” Table is a MUCH better description than “Bridge”
I debated using a “bridge” metaphor to describe the role of the Periods table but I think that’s misleading – a bridge helps you travel from point A to point B: A –> Bridge –> B. That would make you think that we’re “starting” on the Sales table and “traversing” the Periods table to get to the Budget table.
But that’s not how it works. Neither Sales nor Budget is “in charge” here – neither is the starting point. There are two separate paths here: Periods –> Sales, and Periods –> Budget. The diagram drives that home:
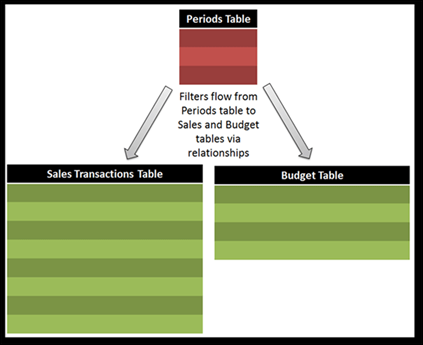
So you should think of the Periods table as being “in charge” here. Which makes sense, since you have to use it on the pivot, and can’t use PeriodID from either Sales or Budget.
Extending that Rule to Fields Other than PeriodID
This is the crux of what I left out of my previous post, and it’s an important rule to drive home:
When you have separate data tables that cannot be combined into a single table (as is the case with Sales and Budget), you CANNOT use row/column/slicer fields from one table in a pivot with measures from the other table. You MUST have a separate “master filter” table, and use fields from THAT table in your pivot.
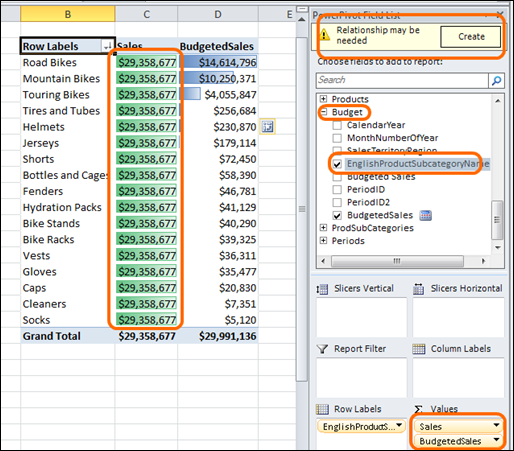
So does that apply to fields other than PeriodID? You betcha. Guess what happens if you use a Product Subcategory or similar field from the Budget table in a pivot that contains a Sales measure (or vice versa)? Yeah, same problem as trying to use PeriodID from Sales as we did above:
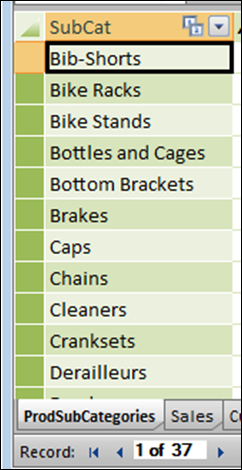
What’s the solution? A separate master filter table for Products!
And that may be as simple as a single column:
Wash, Rinse, Repeat
Once you have measures from two different data tables, every row/column/slicer field you use requires a separate master filter table.
It may sound tedious but it’s actually quite quick. To easily create such a table you can even just use a pivot:
- Put the ProductSubCat field from either Sales or Budget on rows.
- Copy/paste that column of unique values into PowerPivot as a new table.
- Create the relationships to Sales and Budget.
- Use fields from the newly created master filter table in your pivot. Done.
(Better to get someone to add a new view or table to a database for you if that’s available, but copy/paste works well otherwise).
Also Useful for Single Table Situations!
One last point: even when you only have a single table of data, like Sales, it’s often still quite useful to create separate master filter tables.
Why is that?
Because when you create master filter tables, it gives you the opportunity to remove lots of columns from your “big” table.
Imagine a sales table that, in addition to columns like Quantity and Amount, also contains columns like CustomerID, CustomerGender, CustomerAge, CustomerAddress1, CustomerAddress2, etc.
If you leave CustomerID in the sales table but “move” all of the other customer columns into a separate Customer table, and then link the two tables by Customer ID, you can reduce the number of columns in your Sales table by a significant number.
And that can sometimes shrink your files dramatically, AND speed them up. See this post for an example.
Get in touch with a P3 team member