Guest post by David Churchward [Twitter]
You may recall in my last post, COMMISSION CALCULATIONS IN POWERPIVOT, we got to the point where we could dynamically calculate the sales value and attributable commission rate that should be applied based on time, value and team parameters, reading from a Rates table.
In this post, we’ll complete the commission calculation, providing a different value for individuals and the team manager.
Where are we?
Just to recap, we got to the point in my last post where we had calculated [Sales_Value] and [Comm_Rate] as below:

It seemed logical that the concluding element was to simply multiply one value by the other. To a degree that is correct, but unfortunately, it’s not quite so straightforward. Let’s take a look at what that would do with a simple measure that I’ll call [Comm_V1]
Comm_V1 = [Sales_Value]*[Comm_Rate]
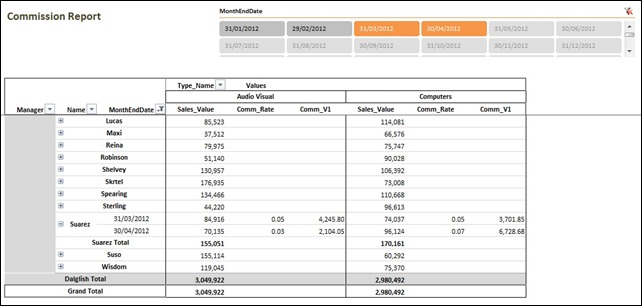
You’ll notice that the measure provides the right calculations, but only at the level of the report where it finds a single People[Name] and Dates[MonthEndDate]. There’s no aggregation above that value but why?
I’ll try to explain. Our [Comm_Rate] measure only calculates when the following condition holds true
IF(COUNTROWS(VALUES(Dates[MonthEndDate]))=1
&&COUNTROWS(VALUES(People[Name]))=1
&&COUNTROWS(VALUES(Types[Type_Code]))=1 ……
This means that we will see BLANK() returned as a [Comm_Rate] when we have more than one Dates[MonthEndDate] or more than one People[Name] or more than one Types[Type_Code]. Our [Comm_V1] measure is therefore trying to multiply the subtotal of [Sales_Value] by BLANK() which will obviously return a blank.
However, check out what happens when I only have one Dates[MonthEndDate]:
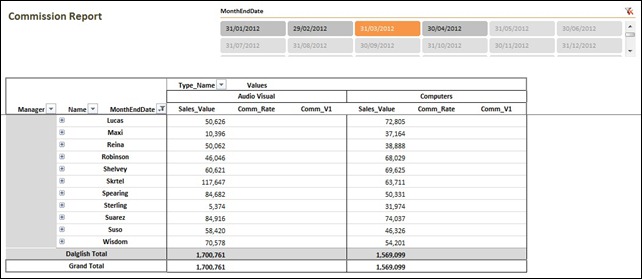
As you might expect, we get nothing back. But look what happens if I open up one of the People[Name] fields:
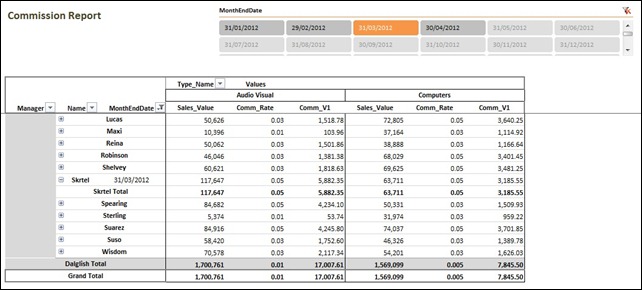
Bizarrely, I don’t just have values for the name that I’ve opened up, but I also have results for everyone else. And, the results are correct. However, it’s useless to us as it doesn’t work with more than one date and I’m pretty sure that this other phenomenon is just a bug.
The Real Solution – Bring on SUMX
There’s been a number of brilliant posts on SUMX such as THIS ONE. In short, SUMX is an iterative function. The syntax for SUMX is SUMX(table, expression). What this means is that SUMX will process the “expression” for each item in the “table”. However, it then goes one step further. SUMX will then SUM the results at each aggregation level in the report.
We know that our “expression” has to be [Sales_Value] * [Comm_Rate] and we want to complete this equation for each Dates[MonthEndDate] because, as mentioned earlier, this is the only level in our report where we can calculate a [Comm_Rate]. We want the outcome of those equations to be added together through the aggregation levels in our report such as People[Name] and People[Manager].
Let’s try that with a measure called [Comm_V2] (I apologise for not being very inventive with these names – you’ve probably guessed from the temporary nature of these names that I’m ultimately going to ditch them )
Comm_V2
=SUMX(VALUES(Dates[MonthEndDate]),[Sales_Value]*[Comm_Rate])
Before I proceed with showing the results of this measure, let me explain why I’m using VALUES(Dates[MonthEndDate]). There’s actually two reasons:
- MonthEndDate is a field on my Dates table. I could use Dates as my table, but I would then be evaluating my expression for every single date in that table. Not only is that inefficient, but it will inevitably give me the wrong answer.
- In order to make SUMX as efficient as possible, you need to present it with the simplest and smallest number of distinct elements. By using VALUES(Dates[MonthEndDate]) I’m creating an “in memory” list of distinct MonthEndDate values. Our expression will be evaluated once for each of these distinct values and we’re not holding a load of excess column baggage in memory.
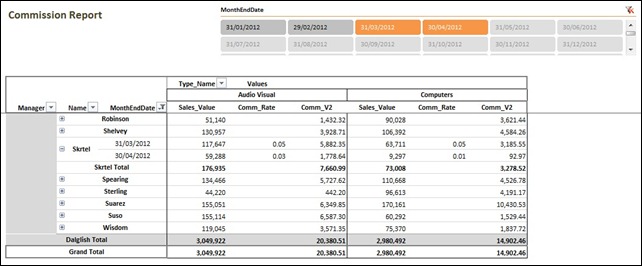
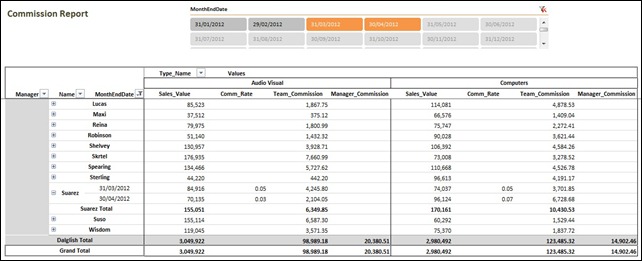
This looks pretty reasonable. The individual monthly commission values are adding up to a correct total for each person. However, is Dalglish’s value correct? I thought this would be the sum of everyone’s commission within the team. If the hidden people are shown and we add up the column, the value for our total of Audio_Visual should be 98,989.18.
So what is this “Manager’s Total” doing?
It would be reasonable to believe that the underlying elements for Dalglish that should be aggregated are the team members (People[Name]) and the Dates[MonthEndDate]. However, we haven’t told PowerPivot to do that. The report is laid out in that manner, but all we’ve told PowerPivot to do is create an aggregation based on Dates[MonthEndDate]. Therefore, PowerPivot has added together the monthly totals for Dalglish as an individual. A breakdown of the equation is as below:

So, it’s actually calculating the Manager’s commission. What if I want it to total the sum of commissions paid to the whole team?
Nested SUMX
The simple answer to this issue is that we have to also tell our measure to aggregate for People[Name]. SUMX only provides for one iteration level. I don’t know the technical reasons as to why that is, but I imagine that providing multiple iterations could present problems with solve orders amongst other things. However, we can nest a SUMX expression inside another SUMX expression. The solution is as follows in a measure that doesn’t have a temporary name (which means it’s right – we hope) – Team_Commission
Team_Commission
=SUMX(VALUES(People[Name]),
SUMX(VALUES(Dates[MonthEndDate]),[Sales_Value]*[Comm_Rate])
)
I want to evaluate our previous SUMX expression for each distinct People[Name] value. Therefore, I use VALUES() to get a distinct list of items in that field and the expression is executed for each member and then aggregated.
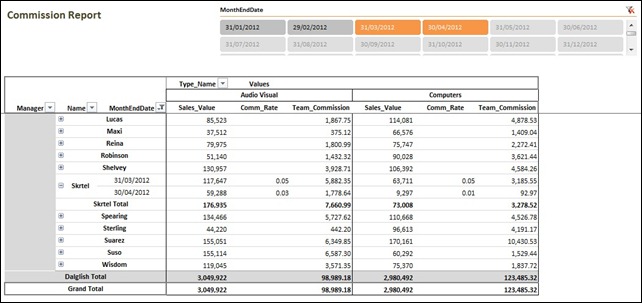
Bingo – we have the right values.
Separate Manager’s Commission
Although our Team_Commission measure is accurate and we don’t have any spurious totals that could serve to confuse, the previous value that we had for Dalglish did make sense in the right context. That was the value that he could expect for commission. It therefore makes sense to compile a further measure that is computed just at the Manager level to show that commission value. It’s a variation on a theme so I’ll jump straight into the DAX
Manager_Commission
=IF(COUNTROWS(VALUES(People[Name]))>1,
SUMX(VALUES(People[Manager]),
SUMX(VALUES(Dates[MonthEndDate]),[Sales_Value]*[Comm_Rate])
),
BLANK()
)
In this measure, we’re iterating over a distinct list of People[Manager]. You’ll notice that I only want this to happen where COUNTROWS(VALUES(People[Name]))>1. I’m using that to determine the “Manager Level” in our report. An individual salesperson would evaluate to 1 in this measure whereas a manager will evaluate to however many individuals in their team which we’re assuming is greater than 1.
Hang on – isn’t that a bit rash! Can a manager have only one report? In theory, I guess that’s true. This is my biggest issue with the way that PowerPivot works with report totals. I’ve only got COUNTROWS in my armoury to deal with this.
Fortunately, there’s a way around it! The answer is to simply add the Manager into the People table and have them report to themselves. I’ve adjusted the table to show Robinson reporting to “Someone Else”. I’ve then created records for “Someone Else” and “Dalglish” reporting to themselves.
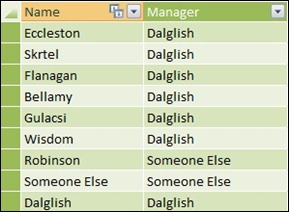
Now my report can handle the fact that a team may only have one member, but it stills manages to understand that my measure has to execute.

And Finally…
I said to Erik in the comments section of the first post in this series that I would show how to calculate commission where the increase in percentage only applies to the element over a certain value. Unfortunately, there’s not time to do this here, but I will come back to it. Sorry that I couldn’t get that in this post Erik.
Get in touch with a P3 team member