“AGAIN!”
-Pai Mei
SUMX() – the great iterator
Have you ever written an array formula in Excel? (Don’t worry, most people haven’t). Have you ever written a FOR loop in a programming language? (Again, don’t worry, there’s another question coming). Have you every repeated something over and over again, slowly building up to a final result?
That’s what SUMX() does. It loops through a list, performs a calc at each step, and then adds up the results of each step. That’s a pretty simple explanation, but it produces some results in pivots that are nothing short of spectacular.
Anatomy of the function
SUMX(<Table>, <Expression>)
THE BRIDE: “What praytell, is a five-point palm, exploding function technique?”
BILL: “Quite simply, the deadliest blow in all of the analytical martial arts.”
THE BRIDE: “Did he teach you that?”
BILL: “No. He teaches no one the five-point palm, exploding function technique.”
That’s kinda how I feel about the description of SUMX in the Beta release: “Returns the sum of an expression evaluated for each row in a table.” It merely hints at the power within.
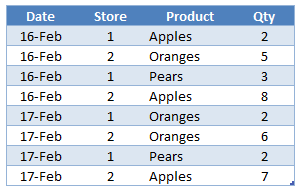
Oddly, the best way to show you what I mean is to start with some useless examples and then build up to useful ones. For all examples, I will use the following simple table, Table1:

Useless Example #1: By the whole table
SUMX(Table1, Table1[Qty])
Returns: 35, which is the total of the Qty column. Might as well just use SUM([Qty]).
Why: Well, it iterates over every row in Table1, and adds up [Qty] at each step, just like the description says it would.
Useless Example #2: By a single column
SUMX(Table1[Product], Table1[Qty])
Returns: An Error
Why: Table1[Product] is not a Table, it’s a Column. And SUMX demands a Table as the first param.
Useless Example #3: By distinct values of a column, sum another
OK, I’ll wrap the [Product] column in DISTINCT(), since that returns a single-column table:
SUMX(DISTINCT(Table1[Product]), Table1[Qty])
Returns: An Error
Why: [Qty] is not a column in the single-column table DISTINCT([Product]). Only [Product] is. Why did I even try this?
That’s where I gave up awhile back. Until I learned…
Almost-Useful Example: The Second Param Can Be a Measure!
And even better, that measure CAN access other columns even if you use DISTINCT. First let’s define a [Sum of Qty] measure:
[Sum of Qty] = SUM(Table1[Qty])
And then re-try the previous example with the measure, not the column:
SUMX(DISTINCT(Table1[Product]), [Sum of Qty])
Returns: 35 Yes, the total, again. But this time, the “Why” is worth paying attention to.
Why: Let’s step through it. Remember, for each value of the first param, SUMX evaluates the expression in the second param, and then adds that to its running total.

Step One: SUMX evaluates DISTINCT([Table1[Product]) which yields a single-column table of the unique values in [Product]:
Step Two: SUMX then filters the Table1 (not just the [Product] column!) to the first value in its single-column list, [Product] = Apples.

Then it evaluates the [Sum of Qty] measure against that table, which returns 17.
Steps Three and Four: The process repeats for Oranges and Pears, which return 13 and 5:


Last Step: SUMX then adds the three results it obtained: 17, 13, and 5, which yields 35.
A lot of work to get the same result that the [Sum of Qty] measure can get on its own, but now that you know how it operates, let’s do something else.
And now, the Useful Example!
Let’s define another measure, which is the count of unique stores:
[Count of Stores] = COUNTROWS(DISTINCT(Table1[Store]))
For the overall Table1, that returns 2, because there are only 2 unique stores.
Let’s then use that measure as the second param:
SUMX(DISTINCT(Table1[Product]), [Count of Stores])

Step One: same as previous example, get the one-column result from DISTINCT:
Step Two: filter to Apples, as above:

…and the [Count of Stores] measure evaluates to 2 – 2 unique stores have sold Apples.
Step Three: Oranges

…again, the measure evaluates to 2. 2 unique stores sold Oranges.
Step Four: Pears

…hey look, only one unique store sold Pears. So the measure evaluates to 1 here.
Last Step: Add them all up. 2 + 2 + 1 = 5. SUMX returns 5. This basically means that there are 5 unique combinations of stores and products that they sell.
Why is that useful?
Well, I can’t share the precise case I was working on, because it belongs to a reader’s business. But trust me, you are going to find yourself wanting this sooner or later.
Things to keep in mind
- SUMX responds to pivot context just like anything else. So if you slice down to just a particular year, your results will reflect only what Stores sold in that year.
- AVERAGEX, MINX, MAXX, and COUNTAX all work the same way. So if you want to iterate through just like SUMX but apply a different aggregation across all of the steps, you can. Those would return (5/3), 1, 2, and 3, respectively in our example.
- The fields referenced in SUMX do NOT have to be present in your pivot view. In my case, SUMX was working against [Store] and [Product]. But my pivot could just be broken out by [Region] on rows and sliced by [Year], and the measure still works. (I like to think of it as a stack of invisible cells underneath each pivot cell that you can see, and SUMX is rolling up a lot of logic across those invisible cells to return a simple number to the top cell you can see.)
More to come!
Yeah, I am not even done with SUMX. Like Jules told you, it’s some serious gourmet DAX 🙂
Get in touch with a P3 team member