Guest Post by Vivek Gargav
Intro from Rob: continuing the series of guest posts that got temporarily shelved, today we have one from Vivek Gargav. This post captures a trend that I monitor quite closely: people who are heavy users of ERP, CRM, and Accounting systems are increasingly realizing that Power Pivot provides FAR superior reporting and analysis, against those systems, than what those systems provide “in the box.”
It makes perfect sense of course. If you are a software company who produces CRM software, your specialty is… CRM software! Not reporting and analysis software. Furthermore, the needs of your customers couldn’t be more divergent – whatever you build “in the box” is inevitably going to be “lowest common denominator” stuff – borderline relevant to everyone, but not terribly insightful for anyone.
Enter Power Pivot. And people like Vivek Gargav.
Background
By Vivek Gargav (twitter | website)

ACT! – a Leading CRM System.
Act! is one of the leading Contact Management/CRM products used by many SMBs worldwide within organisations that in some cases don’t have a formal IT department or resource internally. For many, the sole point for reporting on their organisational knowledge is via the weak and complex native Act! reporter, some even use the Dashboard component to extend their reporting capabilities.
Unfortunately neither of these routes provide the depth of reporting requirements that most businesses need (especially aggregate data) and so Act! users traditionally have had to look at 3rd party add-ons including the old stalwart of Crystal Reports.
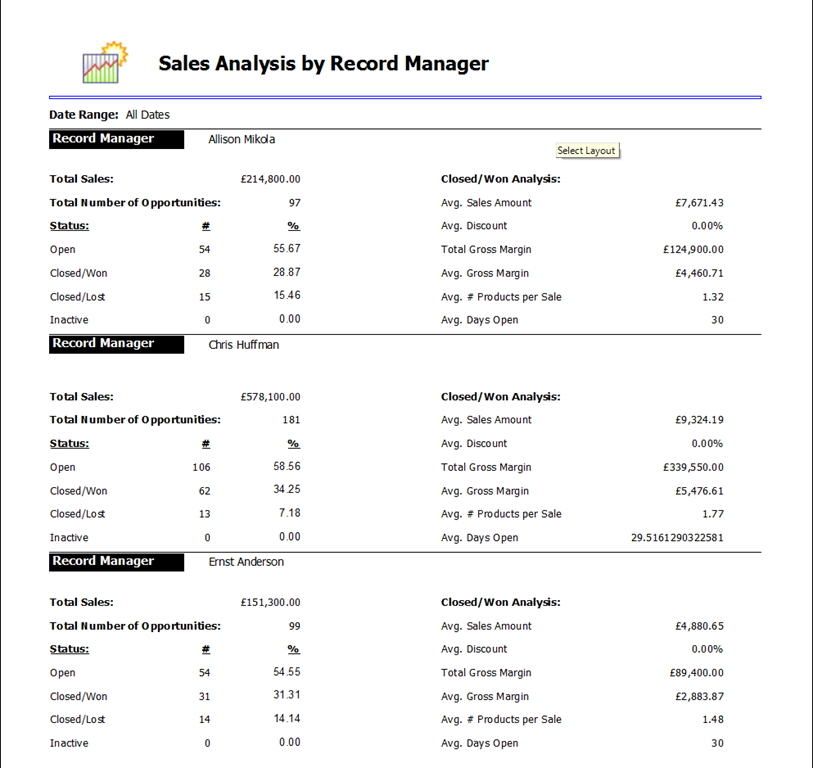
Below, we can see a fairly typical native Act! Sales report. To modify this report and try to get further deep analysis of the data would take a considerable amount of effort, time and expense and in many cases the quality and depth of the resulting BI would only be a fraction of what we can do in PowerPivot, e.g. what we are going to do later is just not possible with the native reporter!

A typical report from ACT! – Power Pivot can do MUCH better!
I Didn’t Realize Power Pivot’s Potential at First
When I first came across PowerPivot in 2010, I must admit that I did not immediately see the value it brought, it wasn’t till the middle of 2011 when the “penny dropped” for me and suddenly I found myself looking at PowerPivot as a “game changer” when it came to reporting on Act!:
- Clients could use their existing licences of Excel without the need to purchase any new software or add-on .
- Users could use their existing knowledge and Excel skills to create powerful reporting solutions quickly.
- Users didn’t require a deep knowledge of SQL to create multi-dimensional analysis of their data.
A Guest Post Invite??
I’ve been coming to p3adaptive.com since I first started using and learning PowerPivot, so when Rob asked if I would like to make a guest post, at first I thought he was joking then when I realised he was serious, I was obviously honoured and excited but left with an over-riding feeling of fear and dread!
What could a simple Act! Consultant and Developer possibly have to offer to Data Analysts and BI Consultants? The honest answer is not very much, but my hope is that there will be others like me beginning their journey into PowerPivot and who may work with Act! who would benefit from a specific real-world use of this fantastic tool! (Note from Rob: you have PLENTY to offer us! These “real world” tales are incredibly valuable – the world literally RUNS on professionals like you, and what you do.)
Data Import Direct from Act! CRM
It’s possible to access the backend data to Act! either via its OLEDB2.0 provider or by connecting directly to the SQL 2008 R2 SQL tables. I would generally recommend using the SQL tables rather than the OLEDB2.0 provider, since the OLDB2.0 provider is dreadfully inefficient. With small datasets this is not normally noticeable, but as soon as you begin to progress above 100k records for any one particular view the probabilities of time outs increasing exponentially. Accessing the SQL tables itself is not always straight forward as the Act! SQL instance has its own SA password that is set by the application and can only be purchased through Swiftpage. However, if you have local administrator rights on the machine where the Act! dB is stored that will enable to gain access or you can use the Act!Reporter utility within the program files where you can set the password for a general Read-Only access to the SQL tables which is good enough for reporting.
The Requirement: Opportunity Forecast Measures!
The client requested that we create a Opportunity Forecast report showing the Estimated Total worth of Open Opportunities that would be expected to close within the next 30, 60 and 90 days by Account Manager, something that is just not possible with the native Act! reporting client.

Even Something Seemingly as Simple as this is NOT Possible via the Built-In Reports
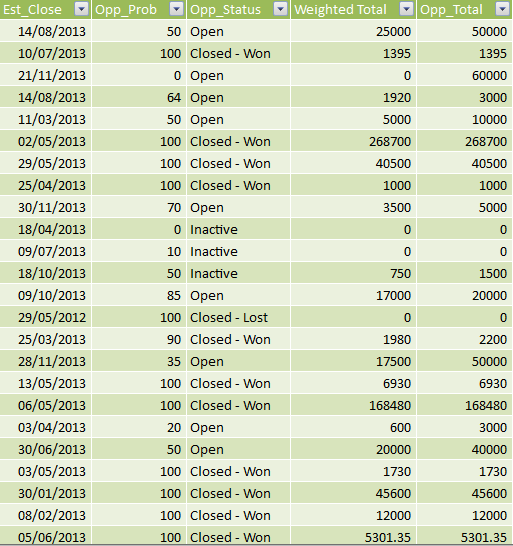
This is a fairly typical request from Sales Managers when they are putting their Pipeline reports together and in all reality it’s a nice and simple one to do. Below we can see the Data Model behind this data, and we are interested in the Opp_Total value.

Creating the Measure
We have 2 options when it comes to filtering on Dates here:
- DATESINBETWEEN
- DATESINPERIOD
We will use the DATESINPERIOD since we want to evaluate the Est_Close Date and SUM the Opp_Total values based on if they are within the next x number of days. The DATESINPERIOD function takes in 4 parameters:
DATESINPERIOD(Dates,StartDate,NumberOfIntervals,Interval)
- Dates : This is the column in our Data Model, in this case it’s Est_Close
- StartDate : The Date to which we want to add/subtract from
- NumberOfIntervals: The number by which we want to evaluate from (can be a negative number)
- Interval: year, quarter, month or day
The following link explains in further detail the DATESINPERIOD.
We Need a Separate Calendar/Dates Table!
I have a small confession to make here and I’ll use this public stage to make this cathartic gesture! When Rob read my initial draft for this post he noticed a glaring (Rob note: common) error I had made whilst using Time Intelligence. I suspect that the more experienced pro’s will most probably be able to guess that it was my failure to use a specified Date table for time intelligence rather than using actual live data- fact tables.
From my understanding of reading around this topic is that you can not guarantee that certain dates within a given month may not have the same number of working days as the previous month, this is one of the reasons why it is necessary and within the design documentation for DAX. Luckily Rob has a very handy article on how to download and implement a pre-compiled Date Table via the Azure marketplace, titled The Ultimate Date Table, though it is perfectly valid to create your own Dates table. For this post, I am using the BasicCalendarEnglish with the following columns:

(Rob note: it’s also crucial that date-related fields on your pivot ALWAYS come from this separate date/calendar table, and NEVER from your data table like Sales/Inventory/Opportunity – see this post)
I have related the DateTable[DateKey] key with the Customer_Opportunity[Est_Close] field so that calculations done within measures using this DateTable are done against that field in Customer_Opportunity.
So now it’s just a simple case of creating a New Measure form the PowerPivot menu in the sheet and create the following Measures:
- 30 Days=>
=CALCULATE(SUM([Opp_Total]),DATESINPERIOD(DateTable[DateKey], NOW(),30,day)) - 60 Days =>
=CALCULATE(SUM([Opp_Total]),DATESINPERIOD(DateTable[DateKey], NOW(),60,day)) - 90 Days =>
=CALCULATE(SUM([Opp_Total]),DATESINPERIOD(DateTable[DateKey], NOW(),90,day))
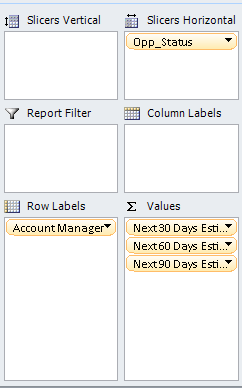
And then we simply add them to the S area of the Field List.

The final report showed that a short marketing campaign that had just begun, seemed to be generating some interest and was in-line with the anticipated service renewal periods for a large number of clients within the following 2 months.

Conclusion
I was at first quite daunted by Measures and had tried to avoid them relying heavily on calculated columns, however there does come a point when you have to take the plunge and look at using Measures. Another very important point not to forget when working with Time Intelligence is to always use Date Tables linked to specific Date Fields and never use a date column directly from a FACT table to avoid the chance of errors. What you’ll find is though initially it can feel a little complicated, it’s actually fun and once you start using Measures in your reports, you really do begin to see the true power behind PowerPivot.
Get in touch with a P3 team member