
I see a lot of Power BI users asking for the ability to set a default slicer selection in their reports. Although this isn’t natively supported as of yet, we can imitate this functionality with a little bit of DAX! A general overview of the process to accomplish this task is as follows:
- Create a slicer.
- Create a measure to determine how many selections are currently made on the slicer. We’ll call this Current Selections.
- Create a measure to determine the total number of possible slicer selections. We’ll call this Total Selections.
- Create a final measure using logic from the previous two steps. If Current Selections = Total Selections, then something, else something (We’ll fill this in later).
This method sets a default slicer selection at the measure level. If there is a difference between the Current Selections and the Total Selections, then we can assume that a selection has been made and the default is not necessary. Let’s run through the steps outlined above. I’ll be using an AdventureWorks database for this demo. The model is structured as follows:
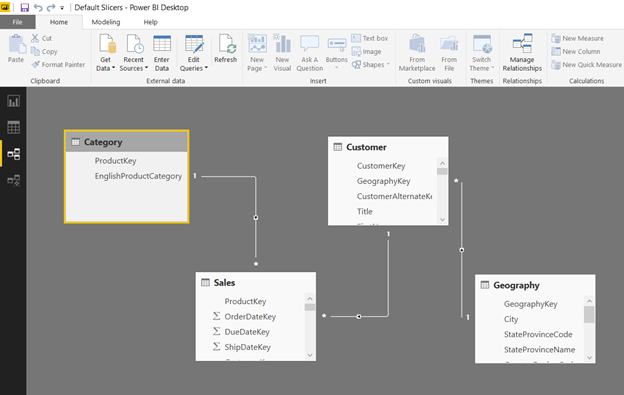
For our first example, we are going to create a basic bar graph showing sales by country that defaults to the United States when no slicer selection is chosen. We’ll start by adding Geography[Country] to a slicer visual. Once this is in place, we just need to create a bar chart and add Geography[Country] to the Axis and Sales[SalesAmount] to the Values well. Simple enough!
![image Geography[Country] Bar Chart](https://p3adaptive.com/wp-content/uploads/2024/04/image-2-6.png)
As you can see, the default behavior in Power BI is to show all of the data when no selection is made on the slicer. Our next couple of steps will change this behavior to only show United States data when nothing is selected.
Let’s now create a measure titled Current Selections to calculate the total number of selections on the slicer currently. The code for this is below.
Current Selections =
COUNTROWS ( DISTINCT ( ALLSELECTED ( Geography[Country] ) ) )
In plain English, this is counting the number of distinct rows in our filtered Geography table. So let’s say we chose Canada and France in our slicer, the Geography table would be filtered down to just records pertaining to Canada and France, and the count of distinct records would be 2. We can throw this measure into a card visual to see this in action.
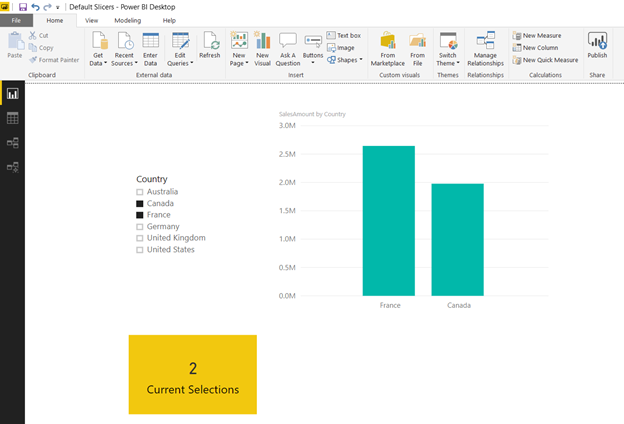
Now we need to calculate the total number of possible selections, regardless of what is chosen in the slicer. This is the exact same as the previous measure, except ALLSELECTED has been swapped out for the ALL function.
Total Selections =
COUNTROWS ( DISTINCT ( ALL ( Geography[Country] ) ) )
ALL removes the filters on the Geography table so the result will always be the number of total possibilities in our slicer.
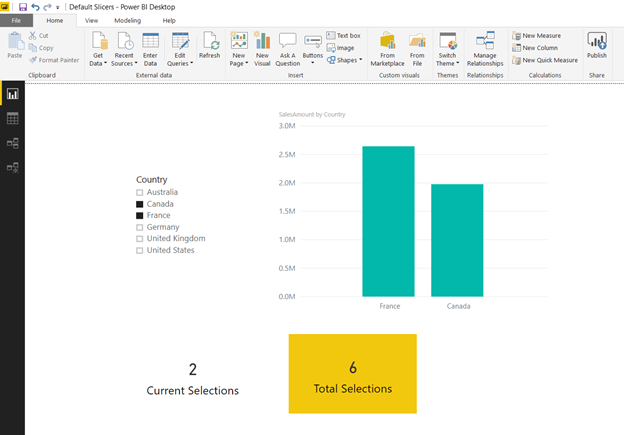
Now that we have the measures set up, we can determine if the number of Current Selections differs from the number of Total Selections. If their values are the same, we will use a default of our choice. If the values are different, a selection has been made on the slicer, and we should show what is selected.
In order to accomplish this, create one more measure titled Sales with Default that will be used in the Values well of the bar chart with the following DAX:
Sales with Default =
IF (
[Current Selections] = [Total Selections],
CALCULATE (
SUM ( Sales[SalesAmount] ),
FILTER ( Geography, Geography[Country] = “United States” )
),
SUM ( Sales[SalesAmount] )
)
Again, in English, if the count of Current Selections equals the count of Total Selections, return the sum of SalesAmount specifically for the United States. If the selection values differ, return the plain sum of SalesAmount. With this measure in place, we achieve our desired result!
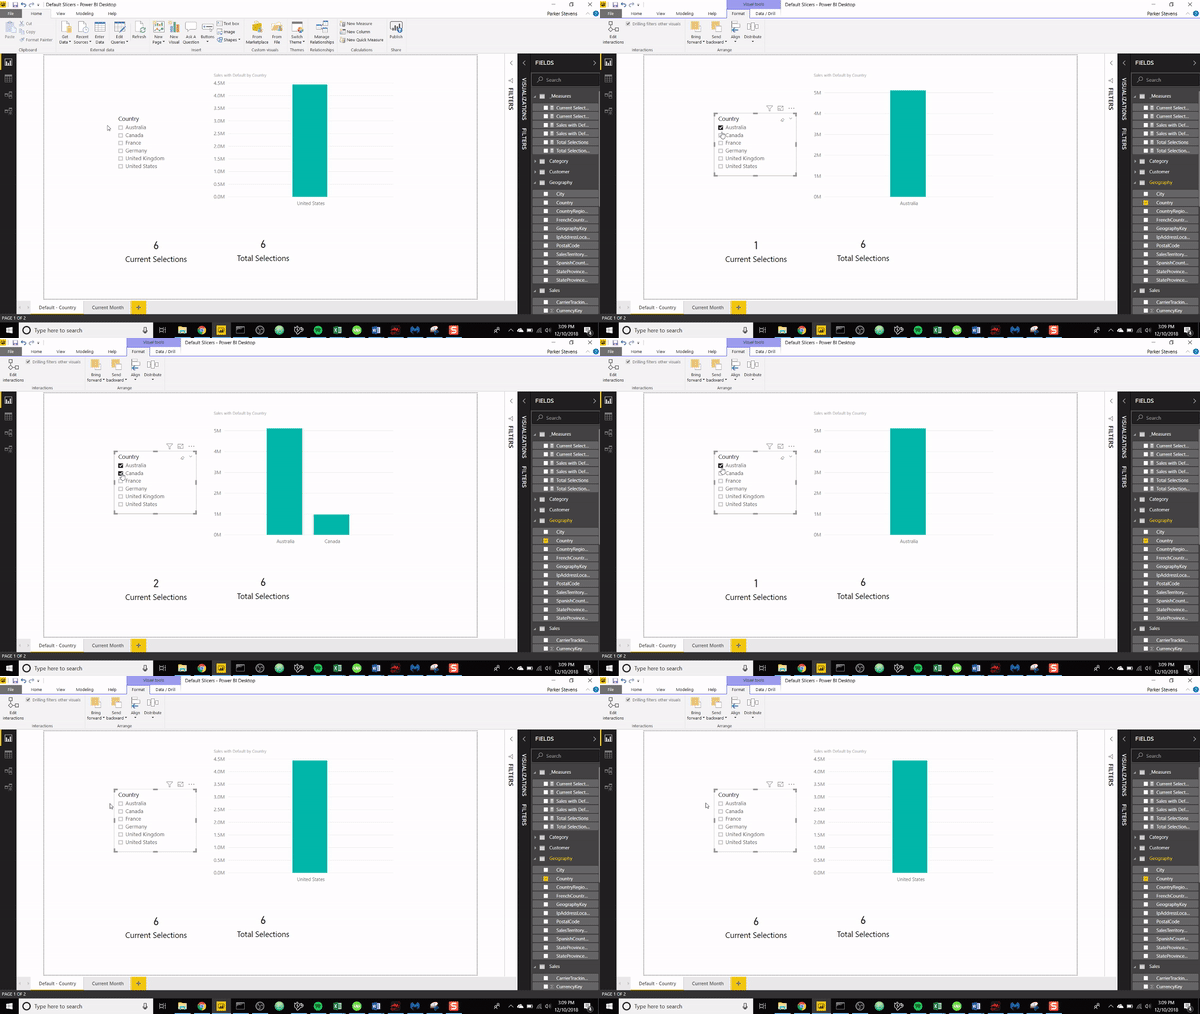
Let’s run through another quick example in order to show how you can default a visual to show only the current month’s data. I’m duplicating the Sales with Default measure and just replacing the logic in the CALCULATE function to only sum the rows with an Order Date within the last 30 days.
Sales with Default (Current Month) =
IF (
[Current Selections (Order Date)] = [Total Selections (Order Date)],
CALCULATE (
SUM ( Sales[SalesAmount] ),
FILTER ( Sales, Sales[Order Date] >= TODAY () – 30 )
),
SUM ( Sales[SalesAmount] )
)
Again, we’re checking if Current Selections equals Total Selections. I duplicated the original Current and Total measures and used Sales[Order Date] in place of Geography[Country] (code below). Coupling this with a relative date slicer, we have pretty nifty filtering capabilities with the addition of the default.
Current Selections (Order Date) =
COUNTROWS ( DISTINCT ( ALLSELECTED ( Sales[Order Date] ) ) )
Total Selections (Order Date) =
COUNTROWS ( DISTINCT ( ALL ( Sales[Order Date] ) ) )
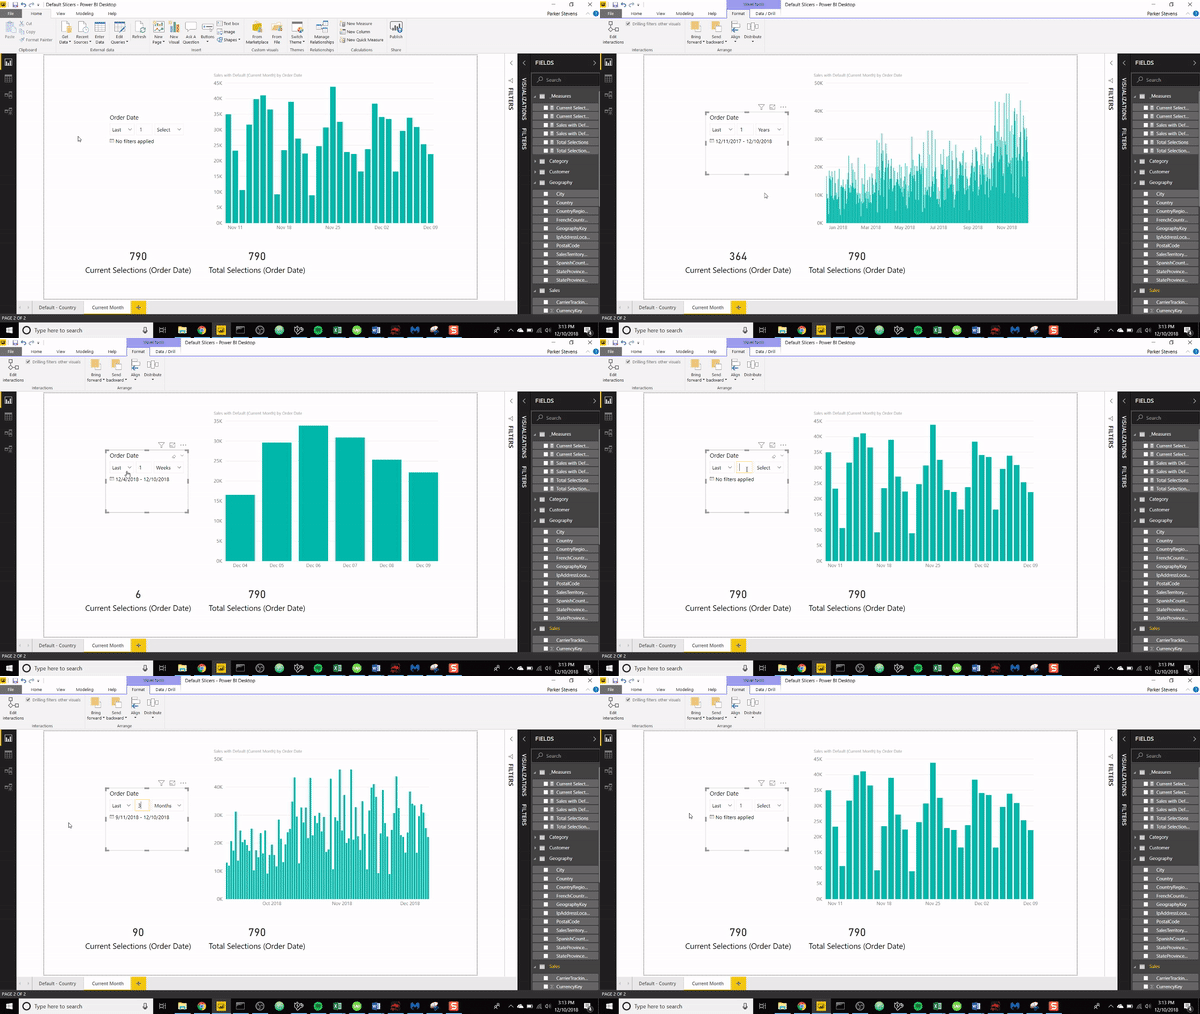
As you can see, when the filter is erased from the date slicer, our bar graph defaults to the current month’s data! We still have all of the functionality of the date slicer with the added benefit of any default of our choice.
And that’s it! You can now set a default slicer selection at the measure level and it only takes a few lines of code! Final note: this trick will not function as expected if you select all of the possibilities in the slicer. If your slicer has 6 possibilities and you manually select all 6, then the measure will use the default, which is likely not what is intended. I hope you enjoyed this tip!
If you want to see this walk-through in video format, check it out on my YouTube channel, BI Elite! https://www.youtube.com/watch?v=pCgK-Ze3nhA
Did you find this article easier to understand than the average “tech” article?
We like to think that is no accident. We’re different. First of a new breed – the kind who can speak tech, biz, and human all at the same time.
Want this kind of readily-absorbable, human-oriented Power BI instruction for your team? Hire us for a private training at your facility, OR attend one of our public workshops!
Get in touch with a P3 team member