Latest Article for CIMA Insight
Some of you know that I’ve been writing a series of articles for the Chartered Institute of Management Accounts, aka CIMA. Up until this point those articles have either focused on the organizational impact, the “why” of PowerPivot. Things like how it contrasts with traditional BI and traditional spreadsheets. How it saves costs and delivers more.
And then I started to introduce basic topics that have already been covered at length here on this blog, just simple how-to-get-started stuff.
But this month is the first time I wrote something for CIMA that I have not really covered here.
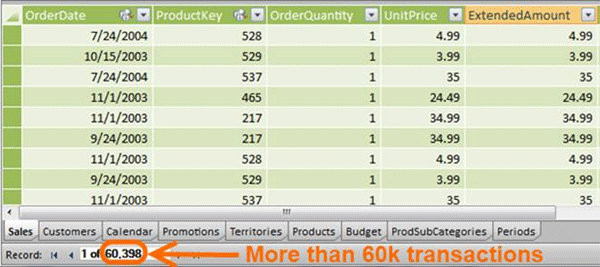
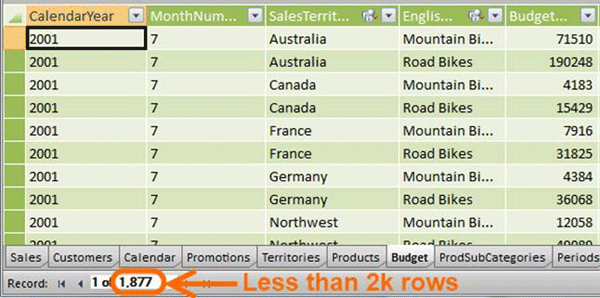
The Problem: 60k Sales Rows vs. 2k Budget Rows


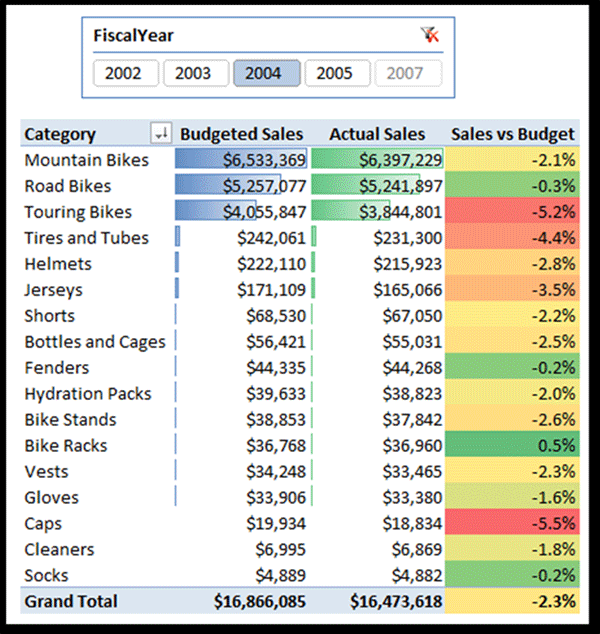
The Desired Result: A Single Unified Report

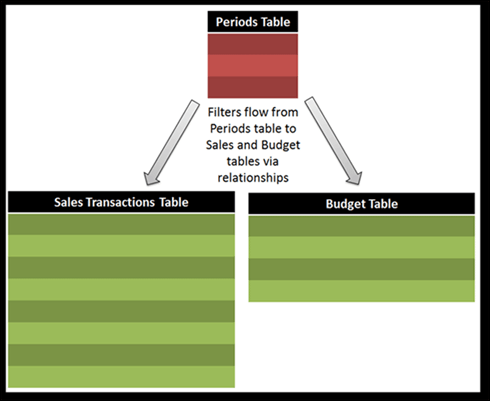
The Solution

Here’s where I have simplified it a bit for the introductory audience. I likely have a Calendar table in a well-designed model, and that doesn’t appear in the diagram. I also likely have to solve for more than just Time granularity – the Budget is also likely less granular at the Product level as well.
But to introduce this powerful concept, I think a simple example is best so I kept it clean.
Popular Topic This Month!
Everyone has this on the brain this month it seems
First, in the exact same issue of CIMA, there’s an article about handling Sales vs. Budget using traditional Excel.
And Marco Russo has written one about this same topic in PowerPivot and BISM Tabular. As usual, his approach is excellent, and quite different from what my more primitive mind conjures.
I didn’t even have to use the Boot Signal:

Get in touch with a P3 team member