Guest Post by David Churchward

You’ll often hear us Accountants referring to things like adjusting for timing differences or prepaying costs or deferring revenue. This is often interpreted as “massaging the numbers”, but, believe me, there is a very reasonable theory behind it. These sort of adjustments can be made for a number of reasons, but the main underlying concept is that adjustments have to be made to ensure that the transaction is reflected in the period to which it relates.
In this post, I’ll explain how prepayments and revenue deferrals work together with the DAX measures that drive these calculations.
What are Timing Differences?
It’s worthwhile just taking the time to understand what we’re trying to do here. Take, for example, a support contract that you bill to your customer in advance for 12 months. You invoice the customer in advance and the customer duly pays. However, as per accounting principles, you have to reflect the fact that the invoice relates to 12 months worth of support. In it’s simplest sense, your Profit and Loss should therefore see 1/12th of that revenue in each reporting month. Since the invoice is for a full 12 months, we have to create transactions to defer the element that relates to future periods, entering the balance onto the Balance Sheet.
As a quick example of the calculation, at the end of the first month to which the support contract relates, you would defer 11/12ths of the invoice value:
Deferral Value = Invoice Value * (Number of Future Months / Total Months on Invoice)
We would therefore see 1/12th of the invoice value on our Profit & Loss and the remaining 11/12ths would be sat on our balance sheet.
Referring to Prepayments separately from Deferred Revenue (or Deferred Costs) for that matter is simply a matter of terminology. The underlying concept of the calculation is the same. I consider everything to be a Prepayment in this sense. The only difference is where the transactions sit in the Profit & Loss and Balance Sheet statements.
Note – Accountants may defer revenue or costs for other reasons. This post is simply a calculation to reflect the timing difference adjustment.
Days or Months
In the simplified example above, I’ve used a monthly concept that allows for a simple allocation of the transaction value to the Profit & Loss in equal monthly values. However, as we know, the number of days in each month can differ. For this calculation to be more accurate, we should pro-rata the calculation based on the number of days in that month.
The DAX measures that I show in this post will allow for selection of Monthly Deferral / Prepay or Daily Deferral / Prepay. Which you use depends on your accounting policy.
Data Structure
My data structure is as follows:
Fact Table (Prepayments)
I have a core fact table which contains all transactions that require a prepayment or deferred revenue adjustment. I have called this table Prepayments.

The key elements to this table are as follows:
Date – This is the transaction date of the invoice posting
Nominal_PandL – This is the Profit & Loss Nominal Ledger account that the invoice was posted to
Nominal_Prepay_BS – This is the Balance Sheet Nominal Ledger account where the prepayment or deferral will be posted to.
Start / End – These are the start and end dates of the transaction. If the invoice relates to a period from 1st Jan 2012 to 31st Dec 2012 then these dates would be 01/01/2012 and 31/12/2012 respectively.
Method – This is either MONTH or DAY depending on the level of granularity that you want your calculation to be calculated at.
PandL_Values – This is the total value of the invoice charge.
Prepay_Start / Prepay_End – I’ll come onto these alternative dates shortly. In brief, these exist because your prepayment timeframe may differ from the strict dates to which the invoice relates.
Days Table

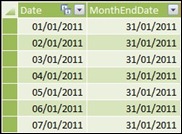
This table holds a sequential, unbroken list of dates (Date) together with associated attributes including Month End Date, Previous Month End Date, Month Start Date and Next Month Start Date. These attributes become relevant in our measures and, whilst these can be calculated at run time, it’s easier to take care of them this way. The purest would be correct in suggesting that there’s a potential performance impact, but dealing with these aspects in our measure may confuse the issue for now!
Months Table

Similar to the Days table, this table holds a collection of attributes relevant at the month level including Month End Date, Previous Month End Date, Month Start Date and Next Month Start Date.
Start Dates Table

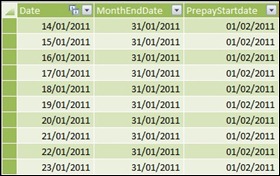
This is another sequential list of dates which is joined to the Start field on the Prepayments table. I’ll come on to the PrepayStartdate field shortly.
End Dates Table

This is another sequential list of dates which is joined to the End field on the Prepayments table. You’ll notice the absence of a third field which, again, I’ll come on to.
Table Relationships

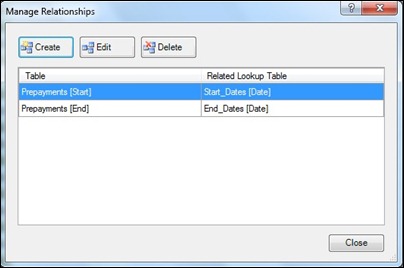
The only relationships that exist are between the Prepayments table and the Start_Dates and End_Dates tables.
Dates That Span Periods
A charge period can be anything. In it’s simplest form, it would be for complete months starting on the first day of a month and ending on the last day of a month. However, things are never that simple. Unfortunately, you could get a charge that is for 3 months from 14th Jan 2012 to 13th Apr 2012 as an example. The time between these two dates is indeed 3 months, but the charge covers 4 discrete calendar months.
If you’re using a Days method of apportionment, this isn’t a problem. However, if you’re apportioning on the basis of months, you have 3 options in this example:
- Take the 3 equal months charges as Feb, Mar and Apr
- Take the 3 equal months charges as Jan, Feb and Mar
- Take equal monthly charges for Feb and Mar with a pro-rata charge for Jan and Apr.
In truth, if you’re going to even attempt option 3, you would probably be better off jumping straight for the Days apportionment and circumvent the problem! Options 1 and 2 depend on accounting policy and president. The prudent option would probably be to go for option 2 for costs (taking them as early as possible) and option 1 for Revenue (taking later rather than earlier). On the basis of consistency, I feel it’s best to prescribe this in your accounting policies and then use the same method for everything. Having said that, the best option is almost certainly to take a Days approach.
For the purpose of this post, I’m going to use option 1. This means that I’ll translate any start date that isn’t the first day of the month to the first day of next month. I create two calculated fields on my Prepayments table as follows:
Prepay_Start
=IF(Prepayments[Method]=”MONTH”,RELATED(Start_Dates[PrepayStartdate]),Prepayments[Start])
Prepay_End
=IF(Prepayments[Method]=”MONTH”,RELATED(End_Dates[MonthEndDate]),Prepayments[End])
These measures retrieve an alternative date from the Start_Dates and End_Dates table. For any mid-month dates, this table holds a PrepayStartdate of the first of the next month.
The Months Approach
Firstly, let’s just remember our simplified equation to give us the deferral value:
Deferral Value = Invoice Value * (Number of Future Months / Total Months on Invoice)
And now we’ll jump straight into the DAX
Month_Prepayment
=IF(COUNTROWS(VALUES(Months[MonthEndDate]))=1,
IF(LASTDATE(VALUES(Prepayments[Prepay_Start]))<LASTDATE(VALUES(Months[MonthEndDate]))
&&LASTDATE(VALUES(Prepayments[Prepay_End]))>LASTDATE(VALUES(Months[MonthEndDate])),
CALCULATE(
SUMX(Prepayments,
Prepayments[PandL_Value]
*(
(CALCULATE(COUNTROWS(Months),
DATESBETWEEN(
Months[MonthEndDate],
LASTDATE(VALUES(Months[MonthEndDate])),
LASTDATE(End_Dates[MonthEndDate])
)
)-1
)/
CALCULATE(COUNTROWS(Months),
DATESBETWEEN(
Months[MonthEndDate],
LASTDATE(Start_Dates[PrepayStartdate]),
LASTDATE(End_Dates[MonthEndDate])
)
)
)
),
Prepayments[Method]=”Month”
)
)
)
The first two IF statements in this measure calculate when we want the rest of the measure to evaluate. We want this measure to evaluate when:
- The number of month end dates on our report is 1 (because anything else is likely to return an error)
- The prepayment start and end dates fit within the range of our report. This, essentially, tells the report which month end dates to display and the rest of the measure uses these dates to evaluate the correct result to display.
We then use a CALCULATE statement to calculate our basic equation:
Deferral Value = Invoice Value * (Number of Future Months / Total Months on Invoice)
Invoice Value = SUMX(Prepayments,Prepayments[PandL_Value]
Number of Future Months =
*(
(CALCULATE(COUNTROWS(Months),
DATESBETWEEN(
Months[MonthEndDate],
LASTDATE(VALUES(Months[MonthEndDate])),
LASTDATE(End_Dates[MonthEndDate])
)
)-1
)
This calculates the number of month values in the Months table using the COUNTROWS function that sit between the MonthEndDate on our report and the MonthEndDate of the end date of our transaction. I then subtract 1 to reflect that the MonthEndDate of the report is not included as it is the current reporting month.
Total Months on Invoice =
/
CALCULATE(COUNTROWS(Months),
DATESBETWEEN(
Months[MonthEndDate],
LASTDATE(Start_Dates[PrepayStartdate]),
LASTDATE(End_Dates[MonthEndDate])
)
)
Once again, I’m counting the number of entries in the Months table that sit between the start and end dates of our prepayment timeframe.
I then apply a filter to the CALCULATE statement to ensure that this measure is only applied to transactions where the Method is set to “MONTH”.
So why do we have to use SUMX for the Invoice Value?
The simple answer is that we need to conduct this equation at the transaction level of granularity and then SUM the results. The main reason for this is that we’re using a division calculation which is only relevant at that level and becomes confused and meaningless when aggregated.
In order to show this, I’ll explain a simple example of converting USD to GBP with some theoretical exchange rates:

What are the values for X and Y? We obviously know that Y needs to be 150, being the sum of the two GBP values. However, if we use SUM, we wouldn’t get that answer. The answer that you would get depends on how you condition your measure but you wouldn’t get an answer of 150, it’s more likely to be 150/2=75 (where MAX is used in the equation) or 250/3.5=71.42 (where SUM is used) or 250/1.75=142.86 (where SUM and AVERAGE is used). The correct value only comes about when you use SUMX which sums the underlying outcomes of the equation and evaluates at the granularity level of the table that you specify (in our case the base level fact table – Prepayments).
This is a very brief outline of a very complex and clever function. In short, if you want to simply add the outcome of underlying equations, SUMX is the way to go.
It’s worth checking out one of my favourite ever posts to start getting to grips with SUMX – SUMX() – The 5 point palm exploding fxn technique.
The Days Approach
This uses the same methods and concepts as the Month approach. The only difference is that we’re evaluating to the number of days in the relevant periods of time.
Days_Prepayment
=IF(COUNTROWS(VALUES(Months[MonthEndDate]))=1,
IF(LASTDATE(VALUES(Prepayments[Prepay_Start]))<LASTDATE(VALUES(Months[MonthEndDate]))
&&LASTDATE(VALUES(Prepayments[Prepay_End]))>LASTDATE(VALUES(Months[MonthEndDate])),
CALCULATE(
SUMX(Prepayments,
Prepayments[PandL_Value]
*(
(CALCULATE(COUNTROWS(Days),
DATESBETWEEN(
Days[Date],
LASTDATE(VALUES(Months[MonthEndDate])),
Prepayments[Prepay_End])
)-1
)/
CALCULATE(COUNTROWS(Days),
DATESBETWEEN(
Days[Date],
Prepayments[Prepay_Start],
Prepayments[Prepay_End]
)
)
)
)
,Prepayments[Method]=”Day”
)
)
)
Prepayments Total
We now have two measures to evaluate our Days Prepayments and our Months Prepayments. We can bring these together in one measure as follows:
Prepayments_Total
=SUMX(Prepayments,[Month_Prepayment]+[Days_Prepayment])
Once again, I have to use SUMX to ensure that this measure sums the total of the underlying calculations.

The “Values Not Prepaying”
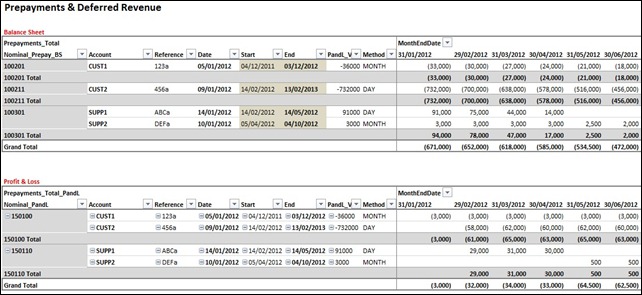
So we’ve dealt with the reducing balances associated with Monthly and Daily Prepayments and Deferred Revenues. However, what about a situation where the invoice charge relates to future months that haven’t yet been reached? For example, we receive an invoice in January that relates to April and beyond, as in the screen shot above where the last entry has a transaction date of 10th Jan but relates to a period April to October. In this instance, we have to prepay (or defer) the full amount of the invoice for January, February, March and April.
Value_Not_Prepaying
=CALCULATE
(
SUMX(Prepayments,
Prepayments[PandL_Value]
),
FILTER(Prepayments,
Prepayments[Date]<LASTDATE(VALUES(Months[MonthEndDate]))
),
FILTER(Prepayments,
Prepayments[Prepay_Start]>LASTDATE(VALUES(Months[MonthEndDate]))
)
)
In this measure, we once again use SUMX to ensure that we SUM the outcome of the underlying evaluations. However, we apply two filters to limit the selection to situations where certain criteria hold. This is an alternative to preceding the CALCULATE with an IF statement to conduct this evaluation first.
- The first filter evaluates when transaction date is less than the MonthEndDate of the report column
- The second filter evaluates when the Prepay_Start date is greater than the MonthEndDate of the report column.
We then add this into our Prepayments_Total measure as:
Prepayments_Total
=SUMX(Prepayments,[Month_Prepayment]+[Days_Prepayment]+[Value_Not_Prepaying])

And there you have it. Our Balance Sheet layout above shows the total value of each transaction that needs to be prepaid or deferred in each month.
What This Means to Accountants
For those Accountants amongst you, you’ll no doubt have cottoned onto the fact that, if you’re careful, this could be your prepayments and deferred revenue reconciliations conquered. The process that I’ve always implemented is as follows:
- Ensure that all transactions are posted to the Profit and Loss in full, as if the P&L was going to take the whole value in one period.
- Capture prepayment start and end dates on each transaction
- Extract the data into a PowerPivot application such as this.
- Refresh to give you the values that need to be prepaid (as per the above screenshot)
- Journal the appropriate values between the Profit and Loss and Balance Sheet on a reversing journal.
- Next month the previous transaction will reverse and you do the same again.
By doing this, you’ve got a self reconciling Balance Sheet for Prepayments and Revenue Deferrals (and all transactions for that matter that have a straight line release – for example, you could use this for elements of Fixed Asset Depreciation but that’s a whole other post).
And One More Thing
You may have noticed in the first graphic that there was also a Profit & Loss impact section to the report. I’ll come onto this in a future post but it uses similar concepts to the measures in this post. With this in place, you’ve got elements of a forecast P&L, you’re on course for Recurring Revenue Assurance analysis and you’re putting in place the building blocks of a full Finance Business Intelligence Application that’s just dying to be exposed in SharePoint as per Rob’s post In the Browser Aesthetics Yield a Greater Return.
Get in touch with a P3 team member