By Avi Singh [Twitter]
In our last webinar the #1 question and confusion seemed to be around Excel versus Power BI Desktop (formerly called Power BI Designer). The thing is, both tools are really part of an ecosystem. And the biggest confusion was around understanding how these tools fit into the overall landscape.
Here is the picture we would build to, but do read through so you understand how we arrived here and also find out how you control the future direction of Power BI (seriously, you do!).
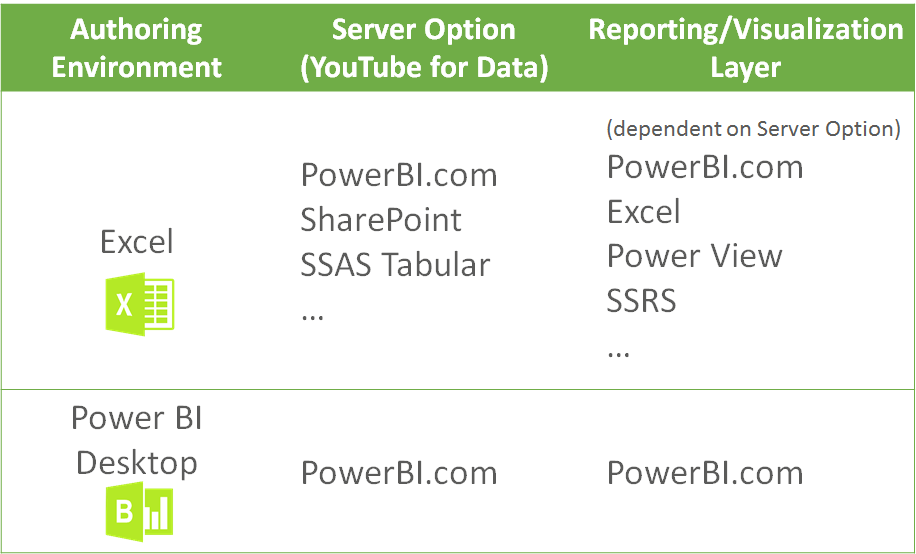
Excel versus Power BI Desktop
Note: Things change fast in the Power BI world, so this picture may change as well
Standalone Tool for End-to-End BI
Rob did an excellent head to head comparison of Power BI Designer versus Excel. Just read that, but I’ll add some commentary.
If you were to use a single tool for BI – getting data, building a data model and building charts/reports – we have firmly established that Excel is the world’s best data tool, period and that is primarily due to it’s internal network effect and that it is easy to adopt.
Excel is the World’s Best Data Tool, Period
Power BI Desktop is a very slick tool, with all different facets meshed together beautifully without any seams showing. Unlike Excel, where due to the “Add-In” nature Power* tools always feel a little clunky, not to mention cases where they go totally awry. But in spite of all that, it is hard, no impossible, to build a tool that can supersede Excel, or replace Excel.
However that is not quite a fair comparison. Because Power BI Desktop is primarily built for PowerBI.com.
Power BI Desktop for PowerBI.com
Power BI Desktop is primarily an accompaniment to PowerBI.com. It is essentially an “authoring tool” for PowerBI.com. Its true purpose is to build something that gets published to PowerBI.com.
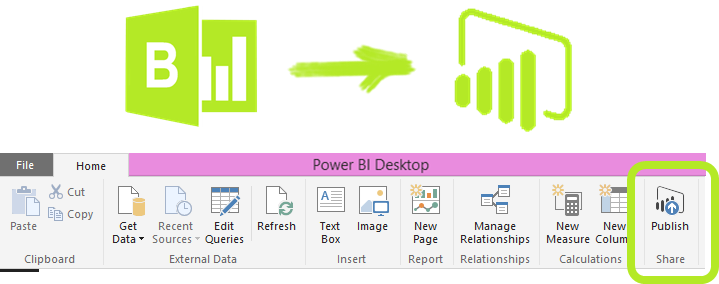
The last step in Power BI Desktop is to publish it to PowerBI.com
You would almost never use Power BI Desktop standalone. Well you may, but understand that it is not really built for that purpose.
With these two combined – Power BI Desktop and PowerBI.com – they outshine Excel in the BI department. With the fluid development environment of Power BI desktop for authors…and the rich, easy to share, mobile ready visualization platform of PowerBI.com.
However that is not a fair comparison either, since Excel models can be published as well.
YouTube for Excel Workbooks (Server Option)
You can use Excel as an authoring environment. Albeit slightly inferior than Power BI Desktop, it still provides you the same general functionality
- Get Data (Power Query)
- Build Data Model (Power Pivot – relationships, DAX measures…)
- Create Reports (Pivot Tables, Charts and Power View)
However the big difference is when it comes to publish. Not only can you upload it to PowerBI.com you could upload it other server options.

Excel Data Model can be published to PowerBI.com, SharePoint or SSAS Tabular
The ideal server option would be agnostic to the visualization tool/layer. It would let you Bring Your Own Visualization tool (BYOV, just like BYOB minus the risk of drunk driving). To learn more about the “Server Option”, watch this YouTube video on our channel.
SharePoint comes close, once you upload your Excel PowerPivot data model (the .xlsx file) to a SharePoint server, multiple users can connect to it using a tool of their choice – online Power View reports (which is Cinderella compared to the ugly sister “Power View within Excel”), SSRS and connect using Excel! See SharePoint and Excel PowerPivot in action in this YouTube videoon our channel.
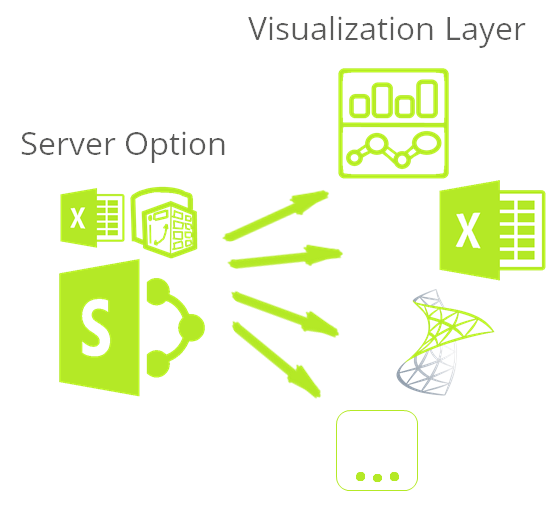
Once hosted on Server, you could connect via a choice of visualization tools
Does that sound bizarre? We built something in Excel, and uploaded it on a server, only to connect to it again using Excel?! Well, that and more. With the server option
- Hundreds of users can simultaneously connect to the model and create their own reports/analysis
- Excel is a great reporting/visualization tool and familiar to many. Thus is a great option to use as a visualization layer.
PowerBI.com Visualization OptionsHowever that is a problem with PowerBI.com at this point. The only visualization option you have is PowerBI.com. As amazing as that is (it offers all sorts of visualizations and mobile functionality) it is still not enough.

As awesome as they are, PowerBI.com visualizations are still not Excel
Remember the joke about “Export to Excel” being the third most common button in any BI application (after okay and cancel). To avoid that fate PowerBI.com needs to allow an Excel file to connect to a hosted data model. So that users can host their models on PowerBI.com and
- Build Reports and Dashbords online to their hearts content
- But also be able to build Excel Pivot Tables and Pivot Charts connected to those data modelFunnel charts and Tree maps are great , but Gridheads like you and me, can’t even think unless we can slice and dice data in an Excel pivot table.So here we are friends…
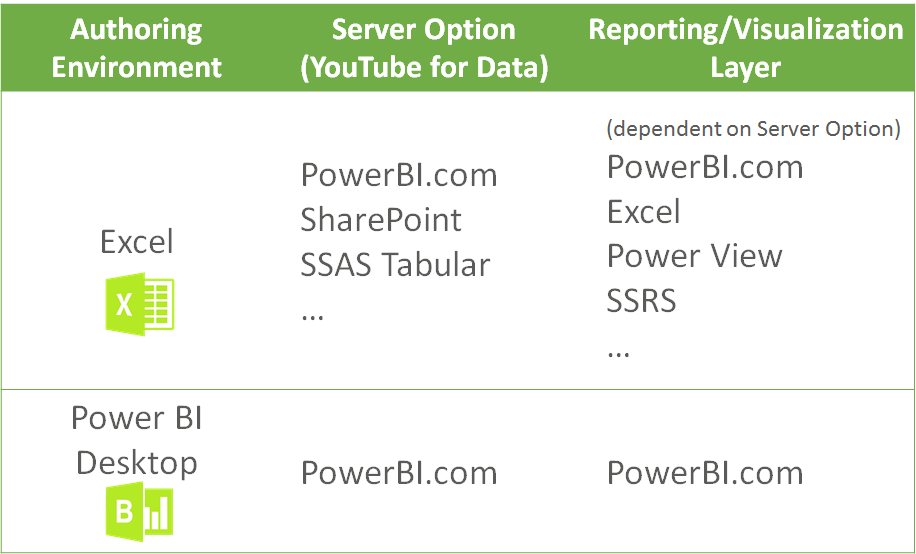
Excel versus Power BI Desktop
As I said, things change fast in Power BI world these days. However as of now:
- If you are “all-in” for PowerBI.com then there is no reason not to choose Power BI Desktop
- Otherwise you have a choice to make. Excel would let you keep your options open. You can still use PowerBI.com but may miss out on the latest features in Power BI Desktop
You Got the Whole World in Your Hands
So where do we go from here? Where ever you decide.Power BI team has been extremely attentive to user feedback. James Philips announcement of the Power BI General Availability says it all, where he says – “Over 500,000 unique users…helped shape the new Power BI”.The BI Pros, have been heavily involved in this process and have greatly influenced the product. Kudos to their involvement they have certainly made Power BI a better product end to end.However it is time for the Excel Pros to also step up and join their voices.Vote or Submit ideas on https://Support.PowerBI.comPlease vote on https://support.powerbi.com for these Excel friendly ideas…Ability to connect Excel to Power BI Data Model and create Pivot/ChartsImport an Excel PowerPivot Model into Power BI Desktop (Designer)Add an “Export to Excel” button to PowerBI.com(heh, heh)…Or submit your own ideas – add them in comments below to get the support (and votes) from fellow P3 Adaptive readers.Power On!
-Avi Singh
Get in touch with a P3 team member