I was recently helping a forum member at https://powerpivotforum.com.au with a problem about how to dynamically calculate an employee’s age. I thought a worked through example would make a good blog post as it demonstrates a further use of disconnected tables vs the more common “disconnected slicers” tables that Rob loves so much.
First let me explain the scenario.
Number of Employees Under the Age of 35
The requirement is to be able to calculate the total number of employees under age 35 years of age at any point in time. The DAX formulae therefore need to take into account new employees starting at the company, employees leaving the company, as well as the fact that all employees get older every year. Here is the solution I created.
Employee Database
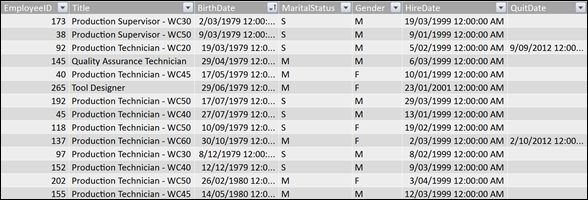
I have used the Adventure Works Employee database from Microsoft – it has a total of 290 employees on record. Each employee record contains a birth date, a hire date and a quit date (assuming they have quit already).
So my source data looks like this.
Calendar Table
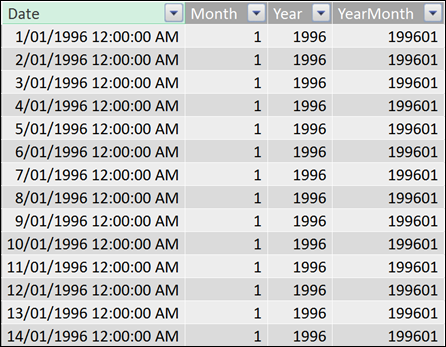
I also created a calendar table with all possible dates starting from the date when the first employee was hired (1996). There is no need for the date table to go back in time to when the first employee was born because I only need to calculate their age when they were actually employed.
The Tables Should not be Linked
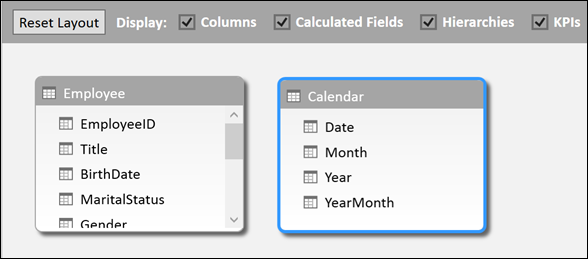
For this scenario, there is no need to link the tables together. There are actually 3 date fields in the Employee table and if you link one or more of these data fields to the Calendar table you will actually get the wrong behaviour. In this case we don’t want to propagate filters from the Calendar table to the Employee table. The Calendar table is therefore loaded as a disconnected table – its sole purpose for existence is so that we can “harvest” the date/month/year data to populate our pivot table rows/columns/slicers as needed. More on that later.
So our 2 tables look like this – loaded but disconnected.
Building the Measures
I built a couple of helper measures that can be used by themselves, but can also be used as inputs to other measures. I like building my DAX this way as it breaks the process of creating calculations down into small manageable pieces, and that makes the whole process easier to work through.
True Quit Date
First I created a [Calculated Quit Date] helper measure. If you look at the data in the [QuitDate] field, it either contains a date (if the employee has left the company already) or it is left blank (if the employee is still working at the company). The [Number of Employees] measure (shown further below) needs a true date value (not a blank), so this [Calculated Quit Date] measure simply replaces all the blank values with the date 9/9/9999.
Calculated Quit Date :=
IF (
ISBLANK ( MAX ( Employee[QuitDate] ) ),
DATEVALUE ( “9/9/9999” ),
MAX ( Employee[QuitDate] )
)
Number of Employees
The next thing I did was to create a raw calculation of the total number of employees. To do this I used CALCULATE( ) with a FILTER( ) function to filter the employee table to exclude employees that haven’t joined the company as yet, and to also exclude those that have already left.
Number of Employees :=
CALCULATE (
COUNTROWS ( Employee ),
FILTER (
Employee,
Employee[HireDate] <= MAX ( Calendar[Date] )
&& [Calculated Quit Date] >= MAX ( Calendar[Date] )
)
)
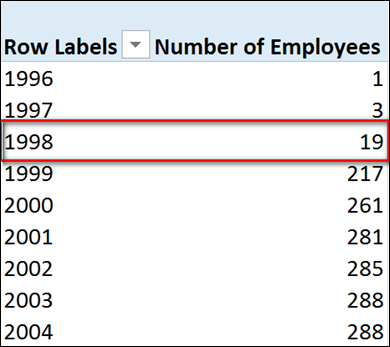
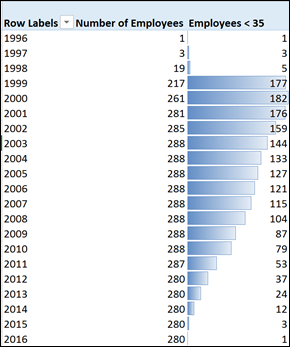
In the measure above you can see where I am “harvesting” the date data from the Calendar table using the MAX( ) function. When you wrap a column in MAX( ) in this way, DAX will respect the current filter context coming from your pivot table. In the sample pivot table below, I have put Calendar[Year] on rows. So the MAX( ) function “harvests” the maximum date in the Calendar table after it is filtered for the specified year by the Pivot Table.
Using 1998 as an example, the Pivot Fable first filters the Calendar table to only contain dates from 1/1/1998 to 31/12/1998. The MAX ( ) function then returns 31/12/1998 to the measure above. Finally the Employee table is filtered to find all employees that had a [HireDate] before 31/12/1998 and had a [QuitDate] after 31/12/1998. This approach makes the measure dynamic and sensitive to the selected dates.
Now of course you could argue that you should include employees that started after 1/1/1998 and that would be a valid approach – it really depends how you want to do the calculation. My calculation is a snapshot at the end of the period however if you wanted to include employees that started after 1/1/1998 you would simply change the formula to use:
Employee[HireDate] <= MIN ( Calendar[Date] )
Employee’s Age
The next step is to create a generic measure that calculates the employee’s age. I have used the same harvesting technique here to take the date displayed in the pivot table and then subtract the date the employee was born. This gives the total “days old” for each employee, so dividing by 365 will calculate the age in years. The same comment as above applies here – this is their age at the end of the period (in this case at the end of the year).
Employee’s Age :=
( MAX ( Calendar[Date] ) – MAX ( Employee[BirthDate] ) / 365
It is probably worth pointing out here that this measure will only work correctly when there is a row context or when the pivot table is filtered for an individual employee (eg if they employee names are on rows). But we are going to use this measure inside a FILTER ( ) function, and FILTER is an iterator that creates its own row context – so there is no problem here.
Number of Employees Under 35 Years Old
In the final step, I built a new measure that recalculates the [Number of Employees] measure but first filters out those that are under 35. This calculation is quite straight forward given I have built the helper measures along the way.
Employees < 35 :=
CALCULATE (
[Number of Employees],
FILTER ( Employee, [Employee’s Age] < 35 )
)
The Benefit of Helper Measures
The [Employees < 35] measure above using helper measures is easy to write and is easy to read/understand. Compare the above version of this measure to the version below that doesn’t use any helper measures. They both give exactly the same answer using exactly the same calculations, however I am sure you will agree that using helper measures makes the entire process easier to read and write.
Employees < 35 Complex:=
CALCULATE (
COUNTROWS ( Employee ),
FILTER (
Employee,
CALCULATE (
(
( MAX ( Calendar[Date] ) – MAX ( Employee[BirthDate] ) )
/ 365
)
< 35
)
),
FILTER (
Employee,
Employee[HireDate] <= MAX ( Calendar[Date] )
&& [Calculated Quit Date] >= MAX ( Calendar[Date] )
)
)
And the Final Result
The final result is a pivot table that allows you to bring in calendar information into rows, columns and/or slicers and get dynamic calculations of the age profile of employees over time.
I have attached the workbook I used for this post here (Excel 2013 format).
Matt Allington is a professional Self Service BI expert, consultant and trainer based in Sydney Australia.
Get in touch with a P3 team member