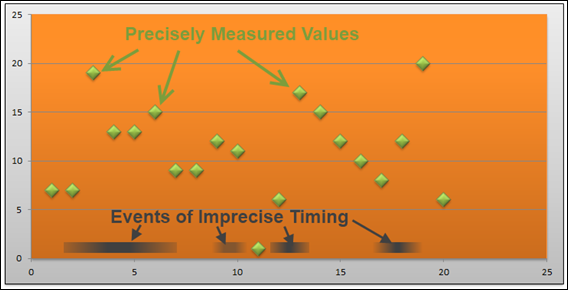
Precisely-Timed Measurements vs. Imprecisely-Timed Events:
How Do We Correlate/Relate Them?
The Streak is Broken… and a new streak begins.
Well it was a full six-month run of posting every Tuesday and Thursday, Cal Ripken-like consistency. Then last week it ended. I was just drained. Oh well, time to start a new streak! Back to Tuesday and Thursday. So let’s dive in…
Calculated columns. I am continually realizing how much there is to know about them – stuff I haven’t really been forced to learn since I rely so heavily on Pivotstream’s database team. My recent work with scientific and medical data sets, starting with the really simple fake data set and then moving into the rat sniffing data, has really driven this home.
So let’s do a quick treatment of fetching data from one table into another, using calculated columns, and in different situations.
When you have a relationship: =RELATED()
OK, I’ve covered this one before. When you have two tables and a relationship between them, you can fetch data from the “lookup” or “reference” table into your data table using the RELATED() function.
But there are really only a few places where you SHOULD do this. You can already include the “lookup” column in your pivots without fetching it into the data table, so there’s little benefit of fetching it. And doing so will just make your file bigger AND your pivots slower.
So really, I just do this when I’m debugging or exploring my data set. When I’m done, I delete the column.
When you don’t have a relationship…
OK, back to the rat data . This will parallel many other real-world examples, such as marketing campaigns etc. So bear with me even if you don’t find scientific measurements to be interesting.
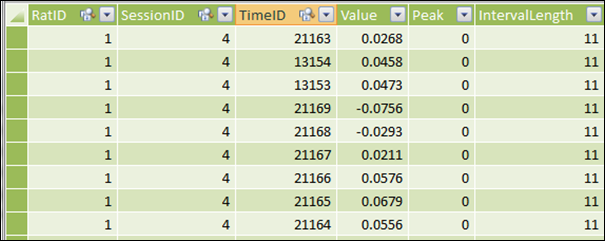
I have one table called “Sniffs” which records how often (and how deeply) the rats were inhaling:

Sniffs Table: Coded by RatID, SessionID, and TimeID
(Where Each TimeID Represents 1/100 of a Second)
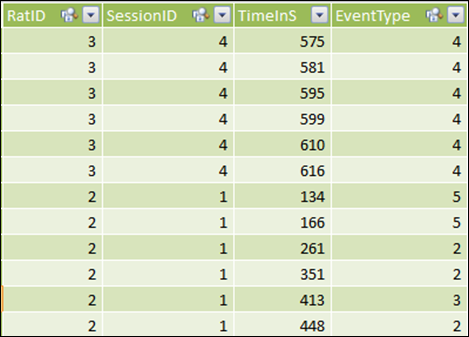
And then I have an Events table. “Events,” in this case, are things that the rats are doing. Like… sniffing each other. In various places.

Events Data – Entered by Humans Watching Time-Coded Video of the Rats
(Note that Time is Recorded in Seconds, not Hundredths of Seconds As in the Sniffs Table)
Event type 4, for instance, is “Rearing” – the rat raising up on its hind legs and sniffing its surroundings. This event is recorded by someone in the lab watching time-coded video.
THE GOAL: We want to see how breathing frequency and intensity (data from the Sniffs table) changes during such events – does a rat sniff more or less when Rearing than normal? (And in Retail, the parallel would be something like “do we get decent lift from our ad campaigns” or “how do spending habits change around a particular event like the Super Bowl?”)
Well, you can’t create a relationship between these two tables, for a few reasons.
Problem 1: Events are Coded at the Second Level, Sniffs at 0.01 Second
In a single second of elapsed time, there will be 100 rows of data in the Sniffs table, and at most 1 row in the Events table. Right there, we have a problem.
Then again, each 0.01 second DOES map to a “full” second, in much the same way as a day maps to a year. The real problem here is…
Problem 2: Both Tables Are Non-Unique in Time Column
Even if we lined up each 0.01 second from Sniffs with a full second from Events, well, I can have multiple rows in Events that all have the same value for TimeInS, because each row is only unique when you consider RatID and SessionID.
Hmmm… so how about I just concatenates RatID, SessionID, and TimeInS to form a unique composite column in Events, and then do something similar in the Sniffs table, and THEN I create my relationship?
There are two problems with that – one minor, and one fatal.
The minor problem: this will make my file quite a bit larger, by adding a column to my largest table (Sniffs). And it’s the worst kind of column to boot: a calculated column with a lot of unique values. Plus, it will form the basis for a relationship, which means my pivot performance will potentially be slow.
The fatal problem?
Problem 3: The TimeInS Value in the Events Data is Imprecise!
First of all, the video of the rats’ behavior will never be precisely aligned with the scientific equipment that is measuring the rats’ breathing patterns. There is some “wiggle” in that synchronization, maybe as much as half a second.
Secondly, this is compounded by human error and variability – the act of a rat rearing up to sniff its environment might cover a full two seconds elapsed, but the human being coding the video must pick a single second to flag the behavior.
Taken together, we can see that there’s really a fuzzy “range” defining when the event occurs.
The Solution Part One: Adding “Time Window” Columns to Events
Let’s say I define the “Event” as lasting one second – 0.5 second before and after the time recorded in the Events table.
Then I add calc columns to my Events table that reflect that:

Where the *100 is to convert to the “centiseconds” granularity that I use in my other table (the Sniff table). PostTimeID is the same, except +0.5 rather than –0.5
The Solution Part Two: CALCULATE? In a Calc Column?
Then I can add a calc column to my Sniffs table that “fetches” a corresponding event ID from the Events table whenever there was an event “in progress” for the current sniff row:
=CALCULATE(MAX(Events[EventType]),
FILTER(Events,
Events[RatID]=EARLIER(Sniff[RatID]) &&
Events[SessionID]=EARLIER(Sniff[SessionID]) &&
Events[PostTimeID]>=EARLIER(Sniff[TimeID]) &&
Events[PreTimeID]<=EARLIER(Sniff[TimeID])
)
)
***UPDATE: I realized that EARLIER() was NOT needed in this formula. See this post for an explanation.
Notes on this formula:
- I had to choose some aggregation function, and I chose MAX, but I could have chosen MIN just as easily. SUM and AVERAGE would NOT have worked out for me though. More on this later.
- Everything after that is a FILTER expression – with four clauses all “anded” together with the && operator
- The first two filter clauses basically just say “only grab rows from Events where the Session and Rat match the Session and Rat on the current row in Sniff”
- The function documentation for EARLIER() has a very abstract definition, but in this case you can think of EARLIER() as just meaning “grab the value from the current row in Sniff.”
- The last two filter clauses make sure we only grab rows from Events whose time window includes the current row of Sniff. In other words, if an Event “contains” the time of the current Sniff, it counts
- Going back to the MAX() at the beginning of the formula, the MAX essentially breaks ties in favor of events with larger ID’s. That is of course completely arbitrary. But in truth there are very, very few overlapping events so it hardly matters. If I cared more, I could narrow the window to less than +/- 0.5 seconds, or I could pay more attention to my Event ID’s to make sure that higher numbered ID’s truly were the most significant events.
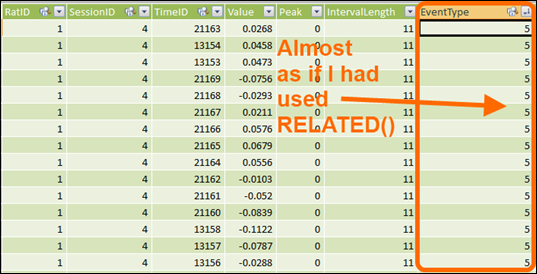
That gives me a result in my Sniff table that basically looks like I had a relationship between the two tables and used =RELATED()

OK folks. I’m tired and about to drop. But hopefully this inspires some thinking, or at least some questions
Get in touch with a P3 team member