Enjoying the new forum!
I’ve been spending some time on the Mr. Excel PowerPivot forum over the past few days and I must say I am enjoying the experience. The blog is essentially a one-way form of communication, given that far less than 1% of views result in comments.
But a forum! Aha! That is different! I encourage you to head over there and drop a question, or maybe even try your hand at answering a question or two when they pop up.
Comparison Across Trials: A Simple and Useful Example
Here’s one that I particularly liked because it’s practical and ultimately pretty simple on the DAX Spicy Scale after a few posts of higher complexity (but also extreme utility).
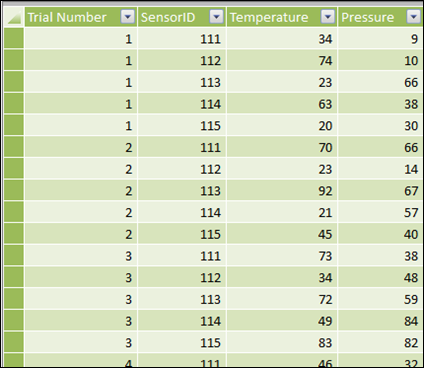
A user over there on the forum named “TopDown” asked a question that I will paraphrase here. Imagine you have a dataset like this:

Measurements Table: A Series of Measurements Loaded into PowerPivot
Basically you have a set of sensors (111 through 115 in this data) and you take a set of measurements at each sensor (temperature and pressure in this example). Then you repeat the measurements over multiple experiments – trials 1, 2, 3, 4, etc.
Topdown had a few questions:
- How do I compare the results of each trial back to the first trial? Absolute difference versus trial #1 and percent difference versus trial 1.
- Do I have to create calculated columns for the absolute and percent difference for each measurement like temperature? (Topdown said he has MANY more than two measurements)
- And if the answer to 2 is “yes,” then how is PowerPivot useful? Once I have the calc columns, I can create this in a normal pivot.
I think intuitively, Topdown sensed that this is a great place to use PowerPivot, and just couldn’t put his finger on the how. He was right. And I really liked this problem because it is so different from the sorts of problems I work on most of the time.
Solution #1: Nothing Fancy
Hey, if you ALWAYS want trial #1 to be the baseline, this is pretty easy. Let’s focus on Temperature for a moment, with the understanding that Pressure will be solved the same way.
First we create a basic measure, AvgTemp:
[AvgTemp] = AVERAGE(Measurements[Temperature])
Then we create a version of that measure that ALWAYS returns the value for Trial 1:
[Trial1Temp] =
CALCULATE([AvgTemp], Measurements[Trial Number]=1)
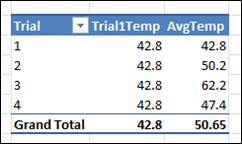
Put both of those on a pivot with Trial Number on rows:

The AvgTemp measure respects the Trial Number filter on rows, just like normal measures do. But the Trial1Temp measure, by virtue of CALCULATE(), overrides that filter and sets it to Trial 1. The only place the two measures “agree” is for Trial 1, as expected.
A couple of quick subtraction and division measures follow:
[Delta Temp] = [AvgTemp]-[Trial1Temp]
[Pct Change Temp] = [DeltaTemp]/[Trial1Temp]
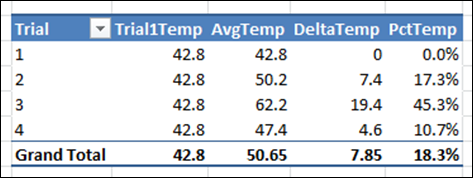
Yielding:

Again, that first row (Trial 1) is pretty useless, but the others are doing what we expect. If that’s distracting, we can filter the pivot to NOT display Trial 1, or we can put Trial on a slicer.
No calc columns required. You just can’t do this in “normal” Excel.
We can stop here and have a quite useful solution, but let’s get just a bit fancier
Solution #2: Let the report consumer choose which trials to compare!
Folks, I am addicted, yes, ADDICTED to what I call “disconnected slicer tables.” What do I mean by that? I mean, tables that I import into PowerPivot for the sole purpose of parameterization. Let the report consumer make a selection, I “harvest” that selection via a simple formula, and then I feed that parameter into my other measures.
I call these tables “disconnected” because I do NOT create relationships between them and the other tables – they are islands.
Here’s one I just pasted into the model. Note that TrialSlicer2 is identical.

TrialSlicer1 Disconnected Slicer Table
(TrialSlicer2 Table is IDENTICAL)
Put both of these new single column tables on slicers and they have ZERO impact on my pivot, since there are no relationships:

No matter what I select on those slicers, [AvgTemp] keeps returning 50.65, because there is no relationship to the Measurements table. The field list is warning me about that, but I don’t want to create one.
Instead, I write measures to “harvest” the user’s selections on those slicers, so that I can use them as parameters:
[SelectedTrial1] =
IF(COUNTROWS(VALUES(TrialSlicer1[Compare To Trial]))>1,BLANK(),
MAX(TrialSlicer1[Compare To Trial]))
[SelectedTrial2] =
IF(COUNTROWS(VALUES(TrialSlicer2[Compare To Trial]))>1,BLANK(),
MAX(TrialSlicer2[Compare To Trial]))
The measures are identical except for the tables they reference, and which tables I “anchor” them to in the field list. The results look like:

OK, now that I have those two parameter measures, I can modify the [Trial1Temp] measure from above to no longer be “hard-coded” to Trial 1. Now I can make it variable by parameterizing it using [SelectedTrial1]:
[Trial1Temp] =
CALCULATE([AvgTemp],
FILTER(Measurements,
Measurements[Trial Number]=[SelectedTrial1]
)
)
Note that I only have to use FILTER() inside the CALCULATE simply because the “normal” parameters to calculate will NOT accept a measure name on the right side of the equals sign.
This new measure responds nicely to the selections made on the first slicer, whereas AvgTemp keeps ignoring it as always:

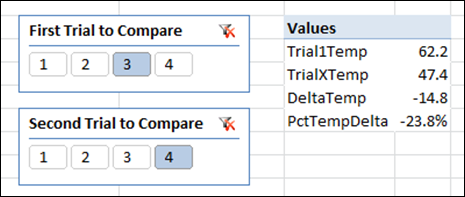
Now I can write a new [TrialXTemp] measure that is exactly the same as Trial1Temp except that it respects [SelectedTrial2] instead of [SelectedTrial1]. Update my Delta and Pct Delta measures and now I have a completely interactive pivot:

Neat huh? And still pretty simple.
Download the workbook, more variations, etc.
And for another example of disconnected slicer tables, see here.
And naturally, if you wanted to write a measure that automatically returns the delta between trial N versus trial N-1, you can always use the Greatest Formula in the World.
Get in touch with a P3 team member