
“He has no filter. He says whatever comes through his mind. He never edits himself.”
Revisiting ALL()
Yes, I’ve used ALL() a number of times already. But I’ve never covered it directly – it’s always been a side topic to something else. So I thought it was time I went back and made sure I had a specific post on it.
The short version is: ALL() removes filters from specific fields during a measure calculation. It “De Niros” your measure… but in a controlled manner.
Syntax
ALL( table_or_column, [column1], [column2], etc.)
So the first parameter is required, and can either be a single column or an entire table.
After that, you can specify as many other columns as you’d like… as long as the first parameter didn’t specify a table. If your first param is a table, you can’t specify additional columns.
Also note that even when specifying columns, the ALL() function requires you to always include the table name.
Lastly, all columns listed must be from the same table.
Legal Examples:
- ALL(Table1)
- ALL(Table1[Column1], Table1[Column2])
Illegal Examples:
- ALL([Column1])
- ALL(Table1, Table1[Column3])
- ALL(Sales[Column1], Customer[Column2])
When to use ALL() – Example #1
You never use ALL() by itself. You always use it in the context of another function. It’s all about setting context for a calculation. It is not a calculation unto itself.
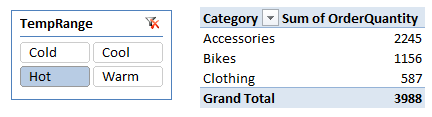
The simplest place to use ALL is in a measure that always shows you a grand total of something, regardless of what filters are in play. Revisiting the Temperature Mashup demo for a moment, here’s a pivot sliced by Temperature, showing a normal Sum of Order Quantity:
Now I add a measure that sets the Temperature table to ALL:
[AllTempsQty] = CALCULATE(
SUM(Sales[OrderQuantity]),
ALL(Temperature)
)
That ends up looking like:

(If you need a refresher on CALCULATE, which is probably the most useful function in all of DAX, check out this post.)
So, on Hot days, we sold a total of 2,245 Accessories. And overall, across all temperatures, we sold 36,092 Accessories.
But note that the numbers are different across Category for both measures. That’s because [AllTempsQty] did not use ALL against the Category columns (or table).
Cool.
Example #2 – % of Total
OK, but in many cases, you don’t actually want to see [AllTempsQty] in the pivot. You just want to compare the filtered version of a measure to the unfiltered version.
So we can define something like:
[PctOfAllTempsQty] = SUM(Sales[OrderQuantity]) /
CALCULATE(
SUM(Sales[OrderQuantity]),
ALL(Temperature)
)
Which gives us:

Note that I switched Excel’s number formatting for this measure to be Percentage, keeping me from having to include * 100 in my measure.
Of course, if I wanted to keep my [AllTempsQty] measure, then I could have defined my new percent total measure as the following instead:
[PctOfAllTempsQty] = SUM(Sales[OrderQuantity]) /
[AllTempsQty]
And that would have produced the same results.
Example #3 – Using ALL() in places other than CALCULATE()
If we revisit the post on derived measures, ALL() is an excellent modifier to use against an existing measure.
Let’s take a measure I defined in the Temperature Mashup, the [Qty per Day] measure:

And then we define a new measure:
[QtyPerDayAllTemps] = [QtyPerDay](ALL(Temperature))
That yields:

You like? I like 🙂
Get in touch with a P3 team member