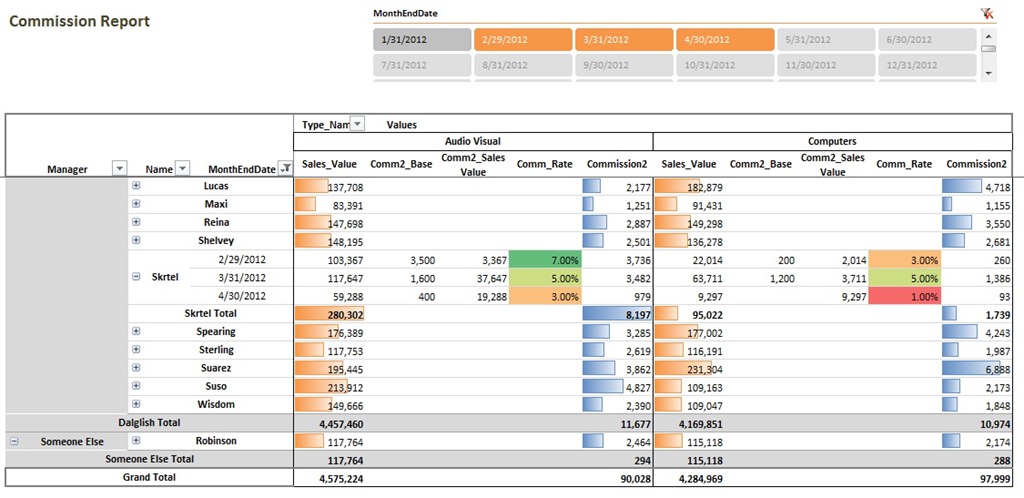
Guest post by David Churchward [Twitter]

I mentioned in my LAST POST that I would return with a variation on that commission calculation. Two months later and very much overdue, here it is! Apologies to those of you who have been waiting on me for this.
I left off with a calculation that applied a commission rate based on a rates table. That rate was applied to the total value.
But what about a scheme where one rate applies to the first N dollars (or pounds, euros, etc.), then another rate applies for the next M dollars, and so on? Income taxes are calculated this way, for instance. And being able to solve this sort of thing in Excel very efficiently (using PowerPivot) will be generally quite useful.
In this post, I’ll explain how to do this in a model that I refer to as Base Plus. And while I will discuss this purely in the context of tiered commissions, keep in mind that it applies to taxes and many other things as well.
Quick Recap
Let’s just recap where we got to. In the FIRST POST of this series, I used a DAX measure called Comm_Rate to compute a commission rate for each individual and each manager for each calendar month.
Comm_Rate
=IF(COUNTROWS(VALUES(Dates[MonthEndDate]))=1&&COUNTROWS(VALUES(People[Name]))=1
&&COUNTROWS(VALUES(Types[Type_Code]))=1,
IF([Sales_Value]=BLANK(),BLANK(),
CALCULATE(MAX(Rates[Rate]),
FILTER(Rates,
Rates[From]<=[Sales_Value]
&&Rates[To]>=[Sales_Value]
&&Rates[From_Date]<=MAX(Dates[MonthEndDate])
&&Rates[To_Date]>=MAX(Dates[MonthEndDate])
&&Rates[Type]=VALUES(Types[Type_Code])
&&Rates[Rate_Group]=”Salesperson”
)
)
),
IF(COUNTROWS(VALUES(Dates[MonthEndDate]))=1
&&COUNTROWS(VALUES(People[Name]))>1
&&COUNTROWS(VALUES(Types[Type_Code]))=1,
IF([Sales_Value]=BLANK(),BLANK(),
CALCULATE(MAX(Rates[Rate]),
FILTER(Rates,
Rates[From]<=[Sales_Value]
&&Rates[To]>=[Sales_Value]
&&Rates[From_Date]<=MAX(Dates[MonthEndDate])
&&Rates[To_Date]>=MAX(Dates[MonthEndDate])
&&Rates[Type]=VALUES(Types[Type_Code])
&&Rates[Rate_Group]=”Manager”
)
)
)
)
)
This essentially “picks” a rate from the rates table based on a series of parameters that filter the rate table down to one record.
This rate is then applied to a total sales value using SUMX in a measure called Team_Commission (there’s also a Managers_Commission but it’s a variation on a theme) as per Post 2.
Team_Commission
=SUMX(VALUES(People[Name]),
SUMX(VALUES(Dates[MonthEndDate]),[Sales_Value]*[Comm_Rate])
)
An Example of the Outcome
Let’s consider an example as follows:
- Category = AV (Audio Visual)
- Month = 31 Mar 2012
- Order Value = £117,647
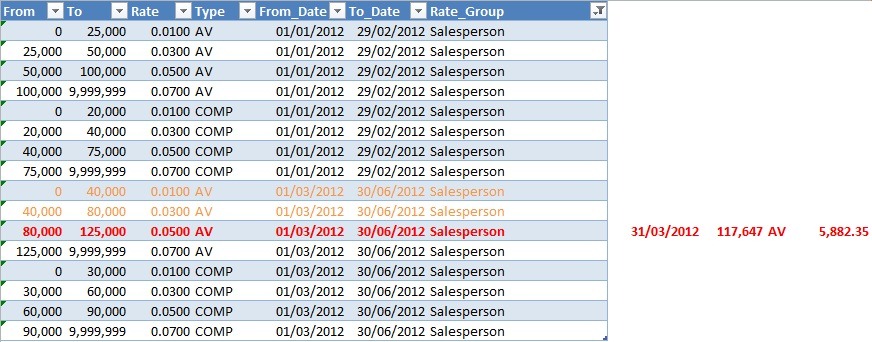
The rate table would therefore be filtered as below:

You’ll notice that the table is filtered down to one record where reporting month end date fits between the From_Date and To_Date, the value fits between the From and To value fields and the Type is limited to AV. Therefore, a rate of 5% is applied to the Order value of £117,647 to give a commission value of £5,882.35.
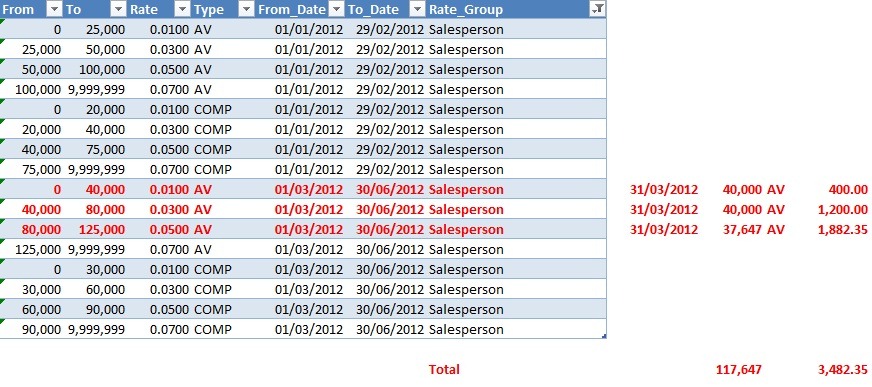
However, an alternative approach could look like this:

You’ll notice that the first £40k of orders attracts a rate of 1%, the second £40k gets a rate of 3% and the balance of £37,647 attracts the 5%. The totals are then aggregated to give a very different value.
This gives us a complication. On the face of it, we’re no longer filtering down to one record. I pondered on this for a while. Inevitably, SUMX was going to come into the equation and probably rightly so. It strikes me that this is what SUMX was made for. However, this could be expensive with regard to performance and there’s complexity around computing the value to apply the commission rate to.
But then it struck me!
While I was pondering the SUMX potential, it struck me that there’s an easier route. Take the previous example above. The value of £117,647 falls between the £80k and £125k in the third red row. All records preceding that row within the same set (ie carrying the same Type and From_Date and To_Date) max out on the commission of that row. That is to say, every value above £80k has a “base value” of the two records above it in the list (ie £40k * 1% and £40k * 3%). Therefore, why wouldn’t I simply add these values together on top of a calculation of row 3?
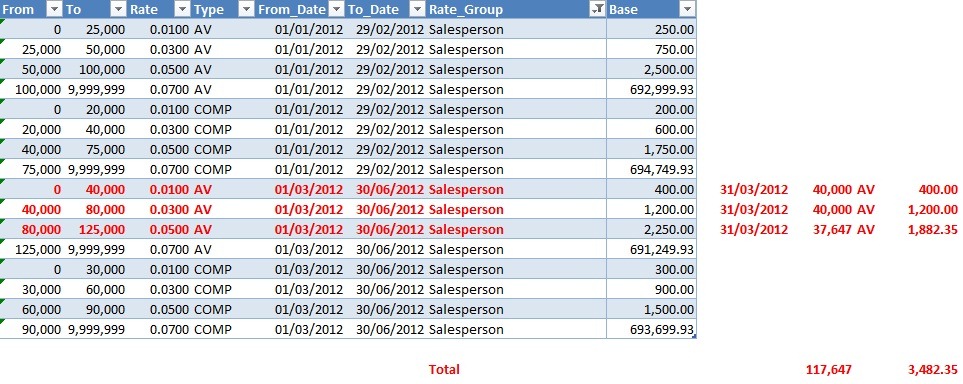
To do this, I introduced a calculated field in my table called “Base” which is simply a calculated column with the following DAX
=ROUND(([To]-[From])*[Rate],2)
[I added the same calculation to the Excel to show this next to my previous example calculation]

You’ll notice that the first 2 red rows give the correct answer and we only need to do something different with the row where the value falls between the From and To values. As it turns out, this is very similar to the approach used in the first 2 posts in this series – anyone might think I had planned it!
My approach would therefore be as follows:
- Calculated the sum of “Base” where the total order value is greater than the “To” value (subject to From_Date, To_Date and Type filters still holding). We’ll call this Comm2_Base
- Calculate total order value less “From” where the total order value is between “From” and “To”. We’ll call this Comm2_SalesValue
- Use the Comm_Rate as calculated in the first post to multiply against Comm2_SalesValue
The Dax
It seems logical to start with Comm2_Base:
=IF(COUNTROWS(VALUES(Dates[MonthEndDate]))=1
&&COUNTROWS(VALUES(People[Name]))=1
&&COUNTROWS(VALUES(Types[Type_Code]))=1,
IF([Sales_Value]=BLANK(),BLANK(),
CALCULATE(SUM(Rates[Base]),
FILTER(Rates,
Rates[To]<=[Sales_Value]
&&Rates[From_Date]<=MAX(Dates[MonthEndDate])
&&Rates[To_Date]>=MAX(Dates[MonthEndDate])
&&Rates[Type]=VAUES(Types[Type_Code])
&&Rates[Rate_Group]="Salesperson"
)
)
),
IF(COUNTROWS(VALUES(Dates[MonthEndDate]))=1
&&COUNTROWS(VALUES(People[Name]))>1
&&COUNTROWS(VALUES(Types[Type_Code]))=1,
IF([Sales_Value]=BLANK(),BLANK(),
CALCULATE(SUM(Rates[Base]),
FILTER(Rates,
Rates[To]<=[Sales_Value]
&&Rates[From_Date]<=MAX(Dates[MonthEndDate])
&&Rates[To_Date]>=MAX(Dates[MonthEndDate])
&&Rates[Type]=VALUES(Types[Type_Code])
&&Rates[Rate_Group]="Manager"
)
)
)
)
)
You’ll notice that this is very similar to the Comm_Rate measure from Post 1. There’s two sections, one for a team member and the other for a manager. The defining difference is that a manager is defined as having COUNTROWS(VALUES(People[Name]))>1. That is to say that there’s more than one person in the aggregation. Both parts of the calculation also define that the aggregation level only has one month by stating COUNTROWS(VALUES(Dates[MonthEndDate]))=1 and there’s also only one product type COUNTROWS(VALUES(Types[Type_Code]))=1.
Aside from that, it’s a simple CALCULATE that is used to sum our new column Rates[Base] where the filter condition holds. The key difference in the filter condition from our previous Comm_Rate measure is that it states that Rates[To]<=[Sales_Value]. Therefore, we’re going to sum the lower value records.
Comm2_SalesValue is also very similar
=IF(COUNTROWS(VALUES(Dates[MonthEndDate]))=1
&&COUNTROWS(VALUES(People[Name]))=1
&&COUNTROWS(VALUES(Types[Type_Code]))=1,
IF([Sales_Value]=BLANK(),BLANK(),
CALCULATE([Sales_Value]-MAX(Rates[From]),
FILTER(Rates,
Rates[From]<=[Sales_Value]
&&Rates[To]>=[Sales_Value]
&&Rates[From_Date]<=MAX(Dates[MonthEndDate])
&&Rates[To_Date]>=MAX(Dates[MonthEndDate])
&&Rates[Type]=VALUES(Types[Type_Code])
&&Rates[Rate_Group]="Salesperson"
)
)
),
IF(COUNTROWS(VALUES(Dates[MonthEndDate]))=1
&&COUNTROWS(VALUES(People[Name]))>1
&&COUNTROWS(VALUES(Types[Type_Code]))=1,
IF([Sales_Value]=BLANK(),BLANK(),
CALCULATE([Sales_Value]-MAX(Rates[From]),
FILTER(Rates,
Rates[From]<=[Sales_Value]
&&Rates[To]>=[Sales_Value]
&&Rates[From_Date]<=MAX(Dates[MonthEndDate])
&&Rates[To_Date]>=MAX(Dates[MonthEndDate])
&&Rates[Type]=VALUES(Types[Type_Code])
&&Rates[Rate_Group]="Manager"
)
)
)
)
)
We’re still using the same approach to filter the Rates table down, but this time we need to select the record where the [Sales_Value] is between the From and To values in that table (together with other filter elements holding true). Once we’re on that record, we subtract the “From” value from the [Sales_Value] to calculate the value that the commission rate should apply to.
With Comm2_Base and Comm2_SalesValue in place, together with Comm_Rate from Post 1, we’re in a position to construct our final measure that we’ll call Commission2.
=IF(COUNTROWS(VALUES(People[Manager]))=1,
SUMX(VALUES(People[Manager]),
SUMX(VALUES(Dates[MonthEndDate]),
[Comm2_Base]+([Comm2_SalesValue]*[Comm_Rate])
)
),
SUMX(VALUES(People[Name]),
SUMX(VALUES(Dates[MonthEndDate]),
[Comm2_Base]+([Comm2_SalesValue]*[Comm_Rate])
)
)
)
This measure first determines whether the aggregation level is a manager level with COUNTROWS(VALUES(People[Manager]))=1. Where this is true, SUMX iterates over the Dates[MonthEndDate] values that are in context, delivering a result of [Comm2_Base]+([Comm2_SalesValue]*[Comm_Rate]) for each MonthEndDate and then iterates over every People[Manager] in context to apply the results.
Where the aggregation level ISN’T a manager, the same formula executes but this time for each People[Name] record in context.
By executing the “Manager” level as the true element of the first IF, the Grand Total picks up the formula relating to the People[Name]. Therefore, our total gives the result of all team member commissions.
And finally, YOU CAN DOWNLOAD THE FILE HERE. Note – this is a PowerPivot V2 file so it won’t work in V1. Sorry if you’re still using V1.
Get in touch with a P3 team member