Recently, we hosted Allision Kennedy on the Raw Data by P3 Adaptive Podcast. During the course of the conversation, our co-host Thomas LaRock expressed his frustration at the lack of a simple method to complete what should be a simple task in Power Query. In Tom’s example, he explained he wanted to replace a given value within the column names without individually renaming all of the columns. He pointed out that this has been possible in Office for 20+ years but requires learning some M to complete in Power Query due to the fact that column headers are not considered data.
Simple frustrations like this have even led our beloved founder, Rob Collie, to make frightening statements about a possible return to Microsoft!
Don’t worry, though, Allision had a very simple fix. In fact, like a moment from the game show “Name That Tune”, she stated that she could solve that in 5 clicks. Even though she explained the process she would use (from memory), we decided to put her solution to the test.
First, we needed some fake data with some seriously lacking column headings. The internet was great and provided us with some data. I finagled some of the headings into what you might see after a merge or an export.

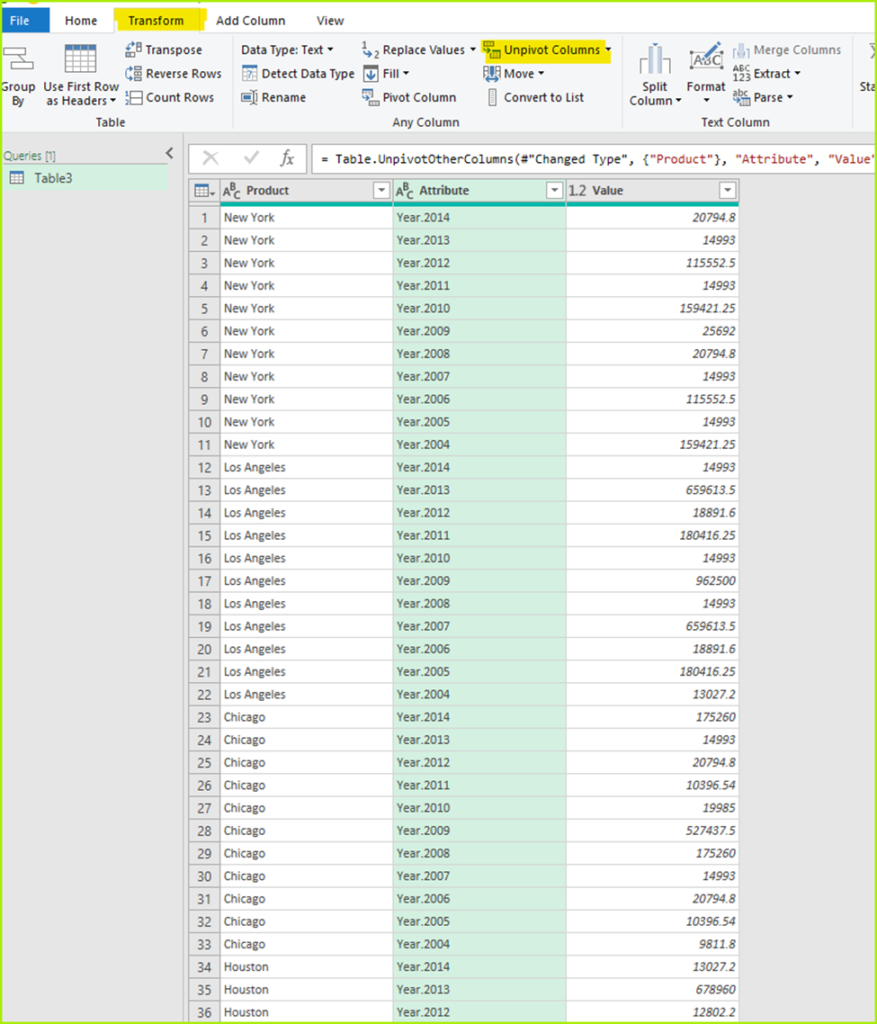
This is perfect to apply Allision’s solution to! The first step is to use the “Unpivot” function to flip the column names onto a row. Unpivot takes the selected column headings and places them in a single column with their values on the row assigned to the column heading. Complete the following steps to unpivot your headings:
- Select any columns with “bad names”
- “Unpivot” the poorly named columns using the function in the Any Column grouping on the Transform tab of the ribbon.
Below is the result of the unpivot. You will see that we have a row for each column heading.

Previously, the table was spread horizontally with multiple columns going let to right. As you can see, the table is now more vertically aligned. With this tablular shape, using “Replace” is a simple process.
In this example, we are going to replace “Year.” while leaving the replace with field blank. This can be completed using a right click on the column heading or by utilizing Replace Values in the Any Column grouping on the Transform tab of the ribbon. This will remove “Year.” leaving just the year. (As a side note, Replace Values can be found in the Transform grouping on the Home tab of the Ribbon as well but since we are already on the Transform tab, we may as well use what we have without additional click throughs.)
To do the replace portion of this example, complete the following steps:
- Select the column “Attribute”
- Click on Replace Values on the Ribbon
- In the dialog box, for Value To Find, type “Year.”
- Leave Replace With blank
- Click OK to apply

As you can see below, we now have a clean year column ready to use when we re-pivot the table.

Now it is time to return our column headings back to their rightful place at the top of columns. To do that, we will re-pivot the table using the following steps
- Select the Attribute column
- Click “Pivot Column” in the Transform tab on the ribbon
- In the dialog box, select the Values column to be the values of the pivot and click OK

Boom! Just like *magic*, we have repaired the messy column headings in under 5 clicks without writing any actual M code and without modifying the source file.

Hopefully, this method can save you some time and frustration when working in Power Query. After all, it came straight from the experts!
Want to watch the method in action to see just how quickly this can be completed. Below is a video showing the process step by step.
It takes a special skill to cleanse and automate exported data. As this article demonstrates, we at P3 Adaptive have what it takes to move your data from infuriating to infatuating. If you are frustrated with your current data situation, reach out to us. We can schedule a private training for your entire team. With a fully P3 Adaptive trained team, you won’t have to worry about messy data again.

Get in touch with a P3 team member