
When comparing Microsoft Power BI vs. Tableau pros and cons, one aspect that distinctly sets them apart is their approach to data modeling.
As Power BI Consulting experts, we believe that their data modeling capabilities are worth discussing. Let’s face it: the data model is like the brain of these tools.
Want to know which is smarter? Read on to find out!
What Is Data Modeling in Tableau?
In the past, Tableau had a data model that assumed your data sources came from a single table or were joined and unioned into one. Their old data model was based on a single layer, known as the physical layer.
However, this approach proved cumbersome and repetitive, especially when dealing with multiple data sources. Users had to manually specify each join or union operation, which could become complex and difficult to manage with multiple sources.
In 2020, Tableau introduced a significant change to its data model by adding a logical layer on top of the physical layer.
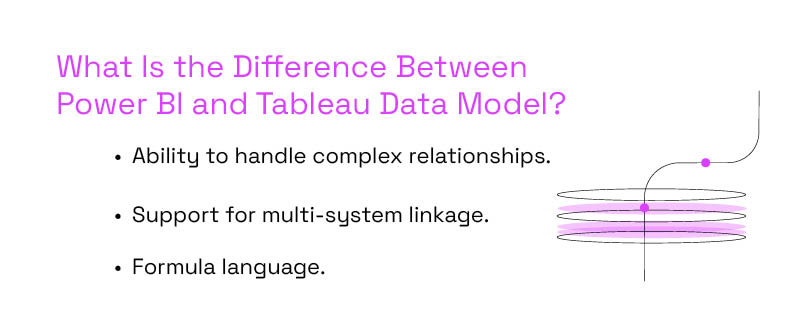
What Is the Difference Between Power BI and Tableau Data Model?
Here are some key differences between data modeling in Tableau vs Power BI:
- Ability to handle complex relationships.
- While it’s common in Power BI to create complex models with many facts and dimensions, Tableau has unsupported models.
- One of these is when you want to link multiple fact tables (e.g., Store Sales and Internet Sales) to multiple common dimension tables (like Date and Customer). This scenario would create a circular relationship, which is not supported. A workaround could be merging some tables or cross-joining Date and Customer to form a single dimension table first.
- Also, in Tableau, directly connecting three or more fact tables on shared dimensions can lead to unwanted results unless you only use dimensions from one table.
- Support for multi-system linkage.
- The Power BI data model is built around the idea of creating relationships between different data sources. This makes it particularly effective for multi-system linkage. It allows users to pull data from multiple systems into a dashboard without manually blending the data.
- Tableau, on the other hand, has traditionally been more focused on individual data sources. While it can join and blend data from different sources, it typically requires more manual effort than Power BI.
- Formula language.
- Power BI extends your data model using DAX (Data Analysis Expression). With DAX, you can add new measures and define calculations.
- Tableau uses MDX (Multi-dimensional eXpressions) for similar functionality. However, Power BI with DAX is more powerful and robust for handling complex calculations and manipulations.
- From the points mentioned above, we can summarize that the Power BI data model is more powerful than Tableau. It’s considered the best in class, making it an excellent choice for comprehensive data analysis and visualization.
What Are the Different Types of Power BI Models With Examples?
In Power BI, there are various data models you can create according to your needs:
- Flat model. It contains only a single flat table.
- Relational model. It involves creating relationships between tables.
- Dimension model. It involves modeling fact and dimension tables.
If you use Power BI for your business dashboards, you’ll typically use the dimension model. It’s great when it comes to measuring your organization’s KPIs.
Now, let’s explore two different types of dimensional data modeling in Power BI with examples.
Star Schema Model
The fact table is in the middle, surrounded by dimension tables.
For example, the following model has a fact table containing sales figures. As you can see, the fact table is surrounded by five dimension tables, each containing details about products, stores, channels, promotions, and calendars.
Snowflake Schema Model
This is an extension of the star schema model, where dimension tables are split into multiple related tables.
For example, the Product dimension table could be split into ProductCategory ProductSubCategory tables, which allows for more detailed analysis.
Is Power BI or Tableau More Useful for Data Analysis?
There is no straightforward answer to whether Tableau or Power BI is more useful. Both Power BI and Tableau offer data analysis and modeling functions. To get a better idea, let’s compare the two. Let’s start with Power BI.
Considering Power BI’s robust data modeling capabilities, this tool gives you many benefits over Tableau if you deal with data from different places. Once you’ve set up your data model, you can find answers to many different sets of questions to get a complete view of your business performance.
According to Tableau vs Power BI Gartner’s comparison, Power BI is great because it integrates seamlessly with other Microsoft products and offers affordable prices. Power BI may be your choice if you are a Microsoft user or a beginner in data analysis due to its cost-effectiveness.
What about Tableau?
Tableau can also pull data from different places. However, building a model from it typically requires more manual effort than Power BI.

What Is the Difference Between Tableau and Power BI Filters?
Both Tableau and Power BI offer filtering capabilities, as you would expect of data visualization tools. While both offer a variety of filtering options, and in fact overlap with many of these possibilities, it is important to note that Power BI does offer one filtering capability that Tableua cannot. Power BI allows for flexible and precise filtering through the DAX formula language — without requiring the user to take additional action.
Get the Most Out Of Power BI’s Robust Data Visualization and Modeling Capabilities
The data model is like the secret sauce of your dashboards.
As our comparison has shown, the Power BI data model stands out for its exceptional power and versatility, particularly when dealing with multi-system linkage. Plus Power BI offers an easy-to-use user interface.
But harnessing that power requires knowledge and expertise. That’s where P3 Adaptive comes in. As a leading Power BI service and consulting firm, we specialize in implementing Power BI data modeling best practices, helping you unlock the full potential of this powerful tool.
Whether you’re transitioning from Tableau or starting from scratch, our team can guide you toward a solution that fits your unique data analytics and business intelligence tools needs.
Let us guide you to get the most out of Power BI’s robust data modeling capabilities.
Get in touch with a P3 team member