A little bit of food for thought today, delivered in a pictorial/humorous style but with a serious point.

A Running Joke That Never Gets Old
I’m quite fond of the following one-liner that I’ve been using in presentations for awhile now:
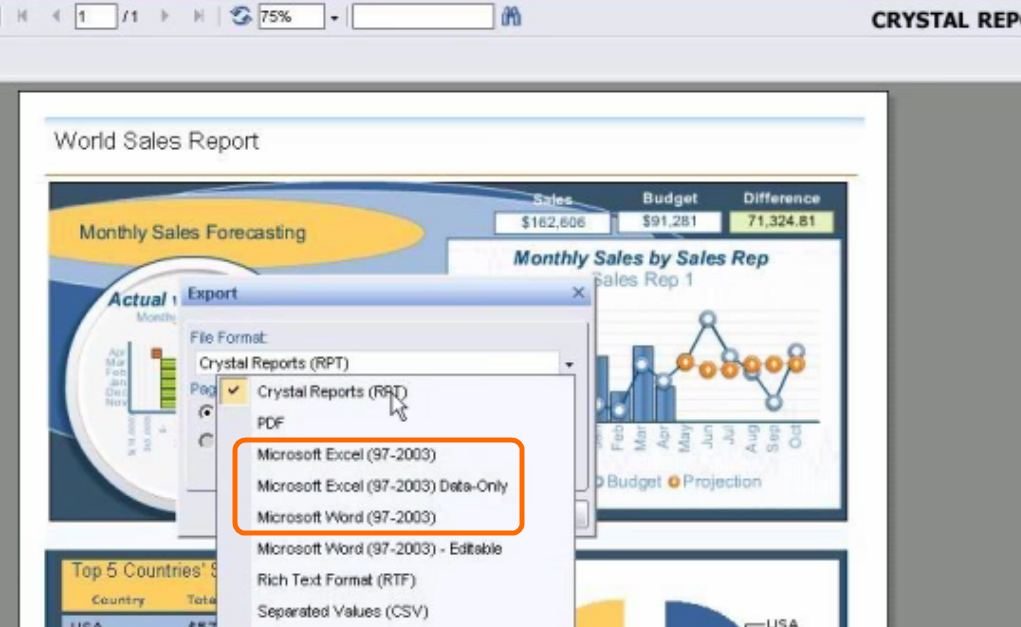
“Export to Excel is the third most common button in data and business intelligence apps… after OK and Cancel.”
That generally brings laughs. It’s ironic of course, since so many business intelligence suites are marketed in part on the principle of “stamping out spreadsheets.” But even the proudest BI suite succumbs to that ever-present force: customer demands.
And so they find themselves, over and over, opening a door to the “dark side.” Let’s take a tour shall we?
Crystal Reports
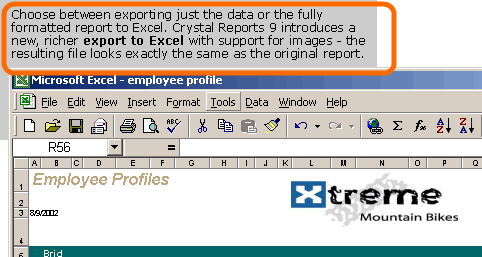
And I really like this marketing point here, about how version 9 added richer support:
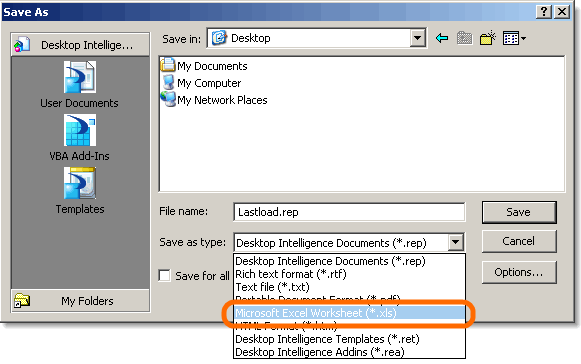
Business Objects
Cognos
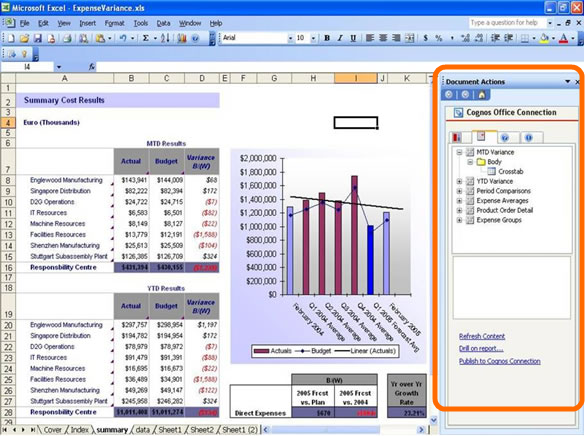
Cognos doesn’t mess around. Why settle for simple export when you can write an entire addin to push data into Excel?
Et tu, Qlikview?
(There is no extra charge for rhymes of such quality)
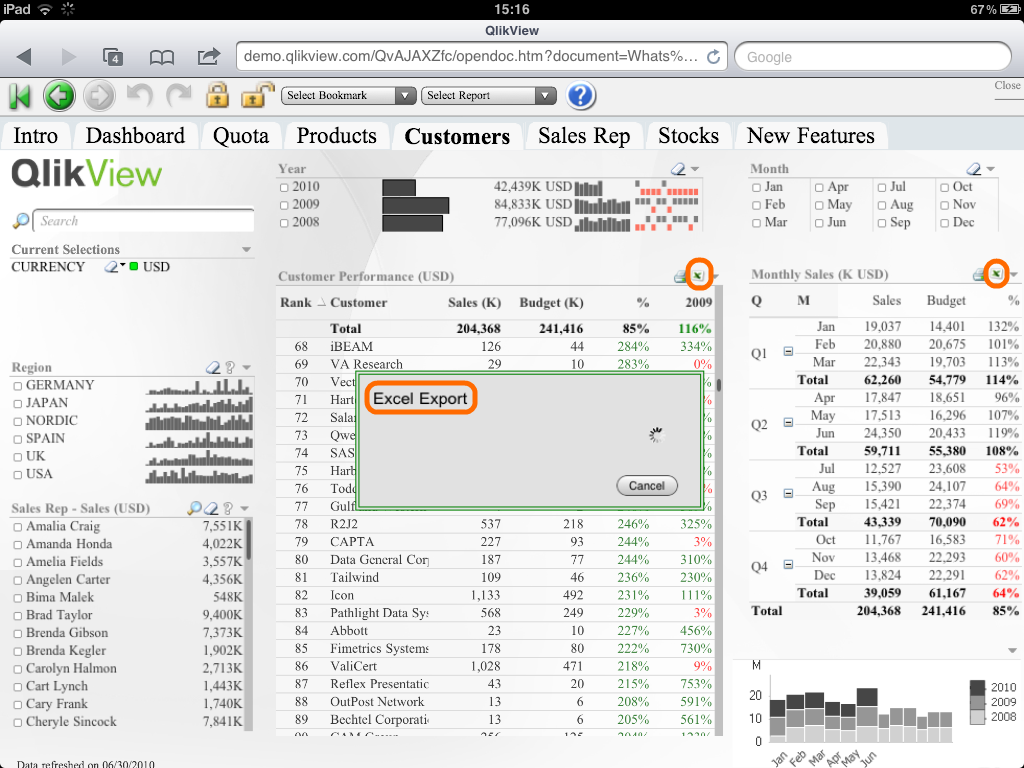
I like that they use the XL icon.
PivotLink
I’m including them because a few members of our team came from PivotLink, and because Pivotstream was using PivotLink until, um, yeah… until I showed up.
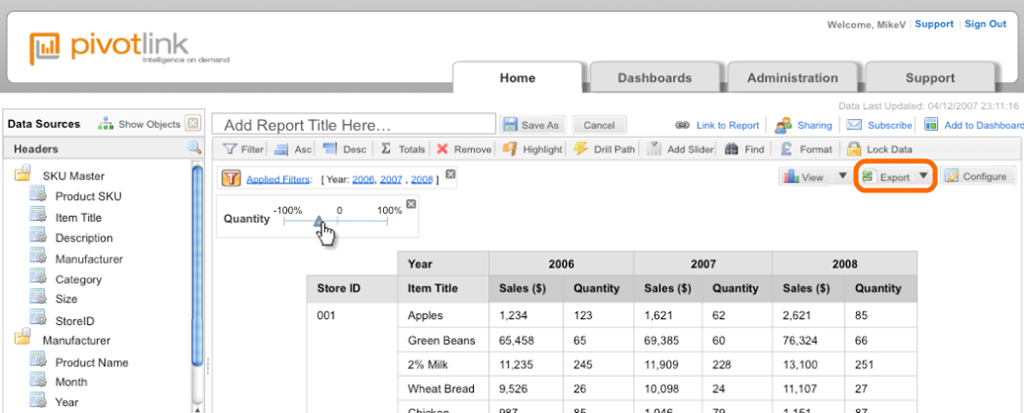
One-upping QlikView, they not only use the XL icon, they give it top billing for the entire export dropdown.
Microsoft
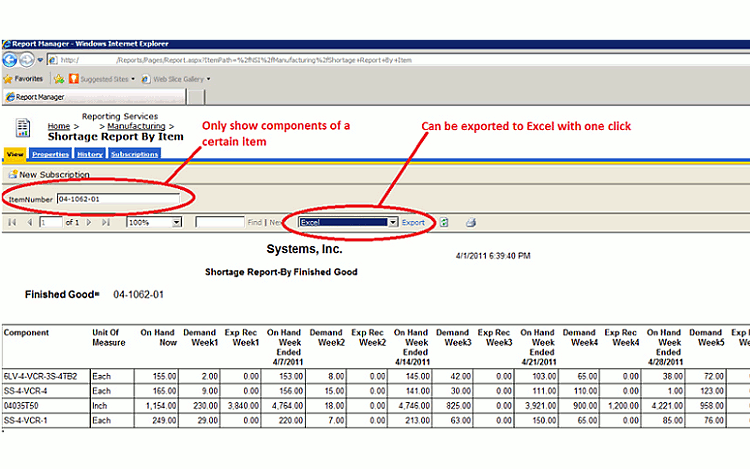
Hey, in fairness, Microsoft products do it, too. Here’s Reporting Services:
And PerformancePoint:
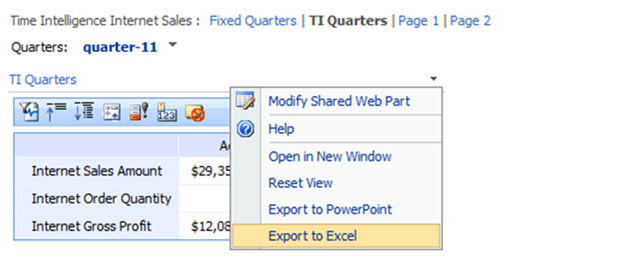
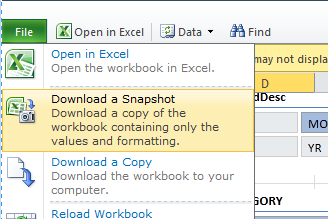
Even Excel Services itself offers “Download Snapshot” which is really just Export to Excel… from Excel!
Why So Prevalent?
Why does everything have this button? Why is export to Excel such a “must have,” even for tools that claim to “break” an organization’s dependence on Excel?
- Excel is widely known. Everyone knows it, or at least when compared to any other BI tool. But everyone knowing it isn’t quite enough to explain why it is so important to take data out of other tools and land it in Excel. It has to provide capabilities lacking in the other tools, which brings us to reason 2…
- Excel is more flexible than any of these tools. Excel isn’t really a tool so much as it is a cleverly disguised programming language. Its capabilities are insanely broad, and those capabilities are all “composeable” with one another – it is not a collection of distinct features, but of building blocks that can be combined in myriad ways.
- Excel is results-oriented and agile. Even when the other tools CAN do something, and the user DOES know how to achieve that, they still often export to Excel because it’s just a lot faster to get the result they want.
My Conclusions
First, this reinforces for me is that Excel remains the common denominator in business analysis and reporting. If that sounds controversial, try building and selling a BI or reporting tool that lacks export to Excel, and let me know how that goes. The companies above all produce good products, and they are smart companies. They implicitly acknowledge what I am saying (with their feature decisions) without explicitly endorsing it (there’s no upside in them doing so, for sure).
Export to Excel also implies an undeniable “drift” away from “one version of the truth.” When I export from a BI tool to Excel, and perform some calculations “in the margin” of the exported data, that is a forked, one-time analysis. It is not captured in any public data model. It lives on my desktop. It represents a “drift” away from the rightly-coveted single version of the truth.
PowerPivot, of course, is not immune to that problem of drift. As I showed above, even server-based Excel has the ability to export snapshots.
But there is an opportunity here, with PowerPivot, that the other tools will always lack. With PowerPivot, an analyst with proper permissions can build their “in the margin” calcs directly into the PowerPivot workbook itself. All the flexibility and familiarity of Excel can be harnessed, but then shared and maintained centrally on the server.
Just as with the other tools, it is undeniably better to build that incremental business logic into the PowerPivot model itself (in the form of new measures, tables, etc.). But sometimes that just isn’t practical. Often that is true, in fact. If it wasn’t true, these other BI tools wouldn’t have the export button!
And once we acknowledge that truth, that “last mile” calculations and similar extensions are common and inevitable, a tool that embrace them directly holds an advantage. I find that pleasantly and rebelliously ironic, that an Excel-based BI tool can hold an intrinsic advantage in “one version of the truth,” which a few years from now we will refer to as “a former weakness of Excel-driven BI.”
Get in touch with a P3 team member