My last 2 blog posts have been about data compression – that theme continues today. In December I blogged about the basics of compression and impacts that columns have on file size and did some testing with randomised data. In January I went a bit deeper and talked about restructuring your data to get better compression. In the comments section of this last post in January there was a seemingly innocuous comment from Mati Selg at the bottom of the page that caught my eye, and that is the topic for today – the compression benefits of sorting your data on load.
SSAS uses segments
Now I am no SQL Server Ninja – I am competent and can work my way around SSMS and write queries as needed, but I don’t come close to a DBA. I have heard of the concept of segments (or groups of records) before and I have a basic understanding, but I never really took much notice until now. My layman’s explanation is that SSAS loads data in groups of records, similar in the way that you would pack your groceries into separate bags to make your shopping easier to carry. In Excel the segment size is 1 million rows. So Power Pivot, sorts, loads and compresses data in segments – 1 million records at a time. Each segment is discreet when it comes to data compression. Of course the segments are magically recombined at run time in a way that is seamless to the user.
OK, so why is this an opportunity?
Imagine you have 50,000 products in your data table and you have 50,000,000 rows of data. Power Pivot will take the first 1 million rows it comes to (1 segment worth), work out how to sort and compress the columns, and then compress the data into a single segment before moving to the next 1 million rows it comes to (in the order they are loaded). When it does this, it is highly likely that every product number will appear in every single segment – all 50 segments. If we assume an equal number of product records for each product (unlikely but OK for this discussion), then there would be 1,000 records for each product spread throughout the entire data table, and each and every segment is likely to contain all 50,000 product IDs. This is not good for compression.
What if you sort the product column first?
Now imagine you sort the data table by the product column first before it gets to Power Pivot. Each segment will still contain 1 million records, but the first 1,000 records will be product 1, the second 1,000 will be product 2, etc. With this “sorted load” of the data, this should lead to an (order of magnitude) 50x improved compression on this one particular Product column (note other columns may be negatively impacted as a result). Now in real life (with real data) some of the products will occur in the data table more frequently than others, but the benefits of sorting are still likely to exist.
Let’s see it in action
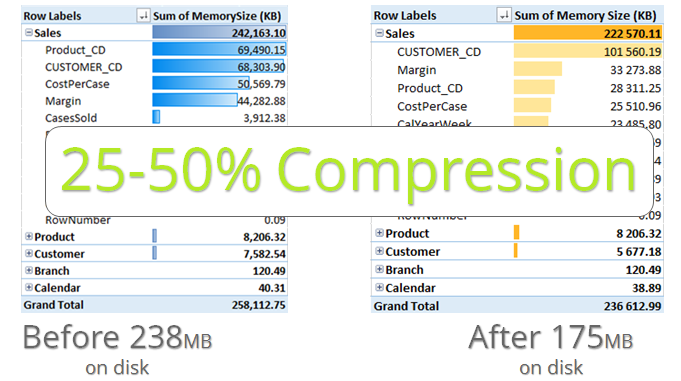
Picking up from the last blog in January, I started originally with a workbook that was 264MB on disk (27.6 million rows in the data table). After completing the compression work discussed last time, the file on disk was reduced to 238MB, a reduction of about 10%.
So now starting with the newly compressed 238MB workbook from last month, I changed my SQL Server Query and simply added an ORDER BY Product_CD clause at the end of the query. This is easy to do as long as you are loading data from SQL Server (or an equivalent DB). Just go to your table in Power Pivot, click on DESIGN\TABLE PROPERTIES and then change the wizard type from Table Preview to Query Editor. You can then simply add the Order by clause in the Query dialog box at the end of the query.

And the result on my test data (which is real data by the way)? A staggering additional 24% reduction in file size from 238MB to 175MB, a reduction of 63MB on top of the previous 10% reduction.
Actually the memory test tool reports 236MB, but the file size on disk is definitely 175MB as indicated below. Note how the column memory usage for a lot of the columns has changed in the before and after scenario. This sorting has flow on effects on almost every column – it is the combined impact of these changes on all columns that will affect the file size.
| Compressed file from January | Compressed file with Product Code sorting on load |
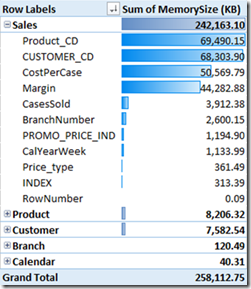 | 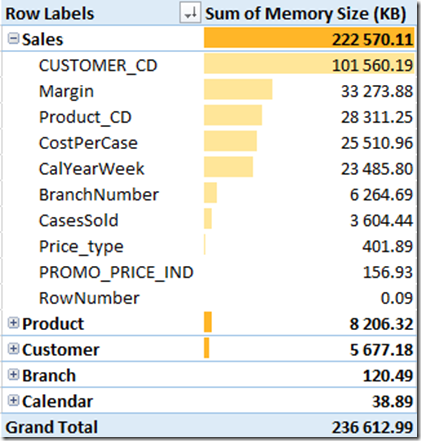 |
| Size on Disk = 238MB | Size on Disk = 175MB |
Now I don’t get excited much, but when I can cut 24% off my file size with this simple change, then that makes me excited.
Edit 10 Feb ’15. I just added a single order by clause to another large (339MB) workbook I use in production. The result – a doubly staggering reduction in file size of 177MB (53% reduction).
Which Column(s) Should I Sort By?
Well to loosely quote The Italians, “It depends. You need to test it on your data as every situation is different.”
What I did next was to change my ORDER BY clause and sorted by Customer instead. As you can see in the memory usage table below, I got further improvements over the Product sorting, however note that the space used on disk is higher.
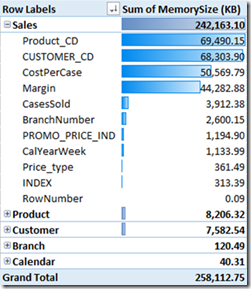

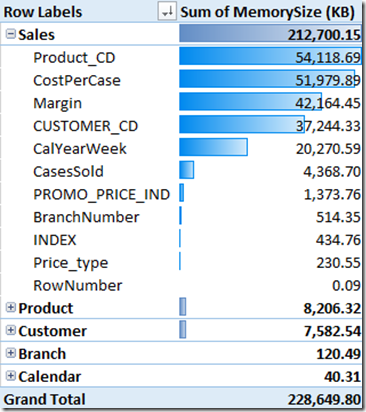
It is not clear to me if the memory usage tool is not reporting the memory usage accurately, or if the standard Excel file compression is having an impact when the file is stored on disk. Regardless, in my case if I am looking for the smallest file sizes so Product Code sorting is better. If any experts reading this can confirm what is happening here, that would be great.
Sorting by 2 Columns?
The last thing I tested was to sort by Product Code and then by Customer Code. This gave me a marginal additional 4MB saving on disk but the memory usage was reported as 248MB, up from 228MB.
Final Comments
Keep in mind that the reason this works is because Power Pivot for Excel loads data in segments of 1 million rows. It therefore follows that you can only get the benefits of sorting your tables if the table in question has more than 1 million rows of data. There is no value on sorting most lookup tables or smaller data tables.
Sydney Training 25/26 Feb 2016
For those readers living in Sydney Australia, I will be teaching Rob’s Power Pivot University Training Course in Sydney on 25th and 26th Feb 2016. Click here to find out more and register to attend.
Get in touch with a P3 team member