-Posted by Rob Collie

OK, I was sitting at the 2nd-day keynote down in New Orleans last month, watching Amir Netz do a demo on some PowerPivot goodies we can expect in the next release.
He was showing off a 2 Billion row model, and its amazing performance, and while that was eye-opening, something he said in passing caught my attention in a big way.
In an effort to explain that what we were seeing (split-second pivot performance against said 2 Billion rows), he said the following:
“Now look at this report! It has 4 pivotcharts and 6 slicers, each of which issues 2 queries whenever I click a slicer, meaning this report is actually querying the 2 Billion rows twenty times!”
Each slicer issues 2 queries against the data source???? It was revelation time. I kinda missed the next couple minutes of what Amir was saying, as I digested the implications for our work at Pivotstream.
And, I was kicking myself for forgetting this, because I had once known most of this in Redmond:
Slicers can, if used improperly in a report, end up slowing a report down by a factor of 5, 10, or more.
Tip #0: Don’t overthink this!
Hey, if your report is fast, don’t obsess. Move on to something else. It is not worth monkeying around with your set of slicers to trim half a second. Remember, slicers are the difference between report consumers loving your work and dismissing it as just more nerdy junk.
When a client recently told us “Reports are dead, now we have Pivotstream!” there was no way we would have received that reaction without slicers.
But every now and then you will find yourself with a report that doesn’t operate quickly enough for your purposes, and slow response times can drain the value and utilization out of a report quickly (well, slowly I guess).
In those cases, one of the first places you should look is your usage of slicers.
Why do slicers issues 2 queries each?
Well, I won’t go into great detail here, because 1) I don’t know every detail and 2) Vidas covered the tech details quite well here.
What I will give you, though, is an intuitive sense of what a slicer has to do.
First of all, it has to populate itself. I don’t know how often it checks to see if something has changed in the underlying model – I’ll have to run some tests. But it’s something to think about:
Tip #1: Are you using a field from your measure table as a slicer?
Say you have a 2 million row table, and one of the columns is Date. When you park that Date column on a slicer, you are demanding that the slicer populate itself from all of the distinct values of the Date column. That doesn’t happen for free – the PowerPivot engine is gonna have to work pretty hard just to generate that distinct list, and it might have to do that every time you interact with the report (click a slicer, change a page filter, etc.)
So, this is yet another reason to consider using a separate, smaller table that just contains all unique dates, and then relating that back to your large table. Then you can use the field from the smaller table in your slicer, and PowerPivot won’t have to burn so much time doing something unnecessary.
Cross-filtering: the incredibly useful but sometimes crippling feature
You know that cool feature of slicers where, as you make selections, other slicers update to show which tiles are valid (clickable) in those conditions, and which tiles are not?
For instance, consider this example:

OK, in week 7 (of all NFL seasons combined in this data set), there were 8 receiving touchdowns scored by players weighing 179 pounds or less.
Now check out the FullName slicer – I have not clicked anything in it myself, but all player names have been disabled except four. That’s because those four players are the only ones under 179 pounds who caught TD’s in week 7. Cool!
Of course, the identification of those four players doesn’t come for free. To drive that point home, I’m just gonna add a second measure to the pivot:

Hey look! Now there are eight players enabled. That’s because there were four players who weighed less than 179 pounds and recorded receiving yards in Week 7.
Stated more generally, any player who has data for ANY of the measures in the pivot, in the conditions dictated by the other slicers, will be enabled.
What does this mean to us? It means quite a bit, actually, once you understand how it works.
Under the hood: what Excel does w/ slicers during a pivot update
I’m sure I will miss a detail or two but that’s not the point. The point is to give you an intuitive understanding.
- Excel takes all of your slicer selections, plus the layout of your pivot (rows, columns, measures), bundles all of that up into a query, and sends it off to the PowerPivot engine
- The data comes back and Excel can populate the pivot with numbers at this point
- But now Excel still needs to determine, for each slicer, which tiles to enable.
- So for every single slicer, Excel does the following:
- Takes all of the selections from every other slicer, bundles those up into a query with the measures from the pivot…
- …And then adds the field of the current slicer to the query, unfiltered, as if it were on the Row Labels axis of a pivot
- Sends that whole query off to PowerPivot, waits for a reply
- When the data comes back, only the values of that slicer field for which at least one measure has data, will be in the result
- Excel ignores the measure values returned and uses the list of returned slicer field values to enable/disable tiles
- Excel then moves onto the next slicer and repeats steps 1-5
That’s a lot huh?
Turning that knowledge into action
There are many tips we can derive from that understanding.
Tip #2: Reduce the number of slicers you use on a pivot
From the above, you can tell that the query being sent for a given slicer is absolutely on par with the query that is used to populate the body of the pivot with data. In fact in some cases, that slicer query can be MORE time-consuming that the pivot itself!
So, if you remove a slicer from a report that your consumers rarely use, you can take a HUGE chunk off of the time it takes for the report to respond to user interaction.
Furthermore, every time you add a slicer to a report, you also make the queries issued for the other slicers more complex, so removing a slicer might make the other slicers’ queries speed up as well.
Tip #3: Watch out for slicers with lots of tiles
I have not confirmed this but feel confident enough to share it anyway: I’m pretty sure that slicers with long lists of tiles are more expensive to update than those with a small number of tiles. Customer Email Address, for instance, is probably much more impactful on performance than Gender.
Tip #4: Reduce number and complexity of measures
Just something to think about. A measure that uses the FILTER function, for instance, is going to be a lot more time-consuming to crunch than a straight SUM. And you might already be 100% cognizant of that.
The point here is that when you add one such complex measure to a pivot, you are not running that measure once per report interaction. You are running it once for the pivot AND once for each slicer, so it adds up faster than you think.
Tip #5: Use a report filter instead of a slicer
Traditional report filters don’t have this cross-filtering behavior, so they don’t impact performance in the ways outlined above. You can use report filters without fear of slowing down your report.
But report filters are ugly, clumsy, and they scream Windows 3.1 – if report filters were so great, we never would have built slicers in the first place.
So I have a better suggestion…
Tip #6: Disable cross-filtering for slicers that don’t need it
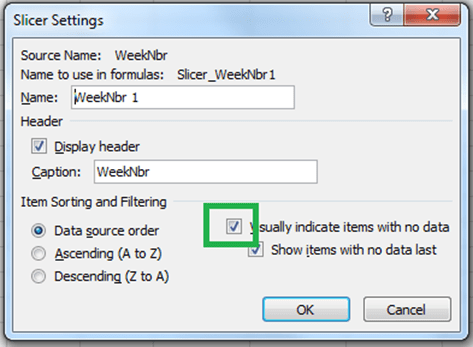
Here ya go. Right click a slicer and click Slicer Settings.
In the dialog, you can uncheck the highlighted checkbox:

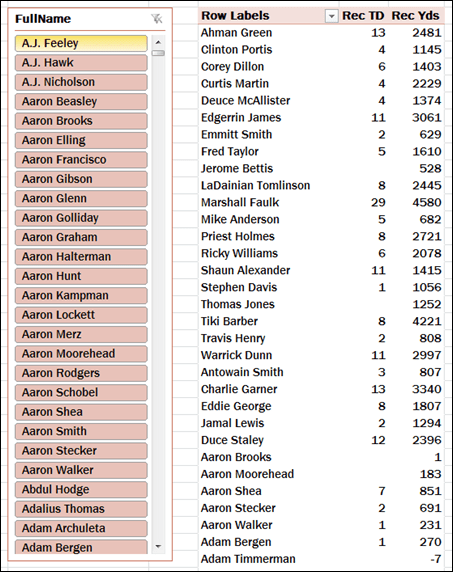
…and now you won’t get cross-filtering anymore. All players will be enabled for example:

Well, for a list like Players, that may not be the best idea. There are thousands of them, and cross-filtering is REALLY useful for helping me narrow down the list and find the players I want.
Then again, having a field with thousands of values in it as a slicer runs contrary to Tip #3, so maybe it’s not such a good idea to have such a slicer in the first place. Can you live without it? It’s worth asking yourself.
Tip #7 Consider using other, shorter fields for slicers
Sometimes I like to use the same field in a slicer and in the pivot itself:

This is just a lot more convenient for limiting the set of players (sometimes) than using the Row Labels filters.
But again, this can incur performance cost, especially for long lists, which is precisely where you may be tempted to “double park” a field like above.
The alternative that’s worth thinking about: maybe a field that’s just the first letter of the player’s last name would be sufficient. Or the team they play for. Or whatever. The idea is to reduce the number of tiles, per tip #3, and sometimes you can get what you want by using a different field.
Get in touch with a P3 team member