
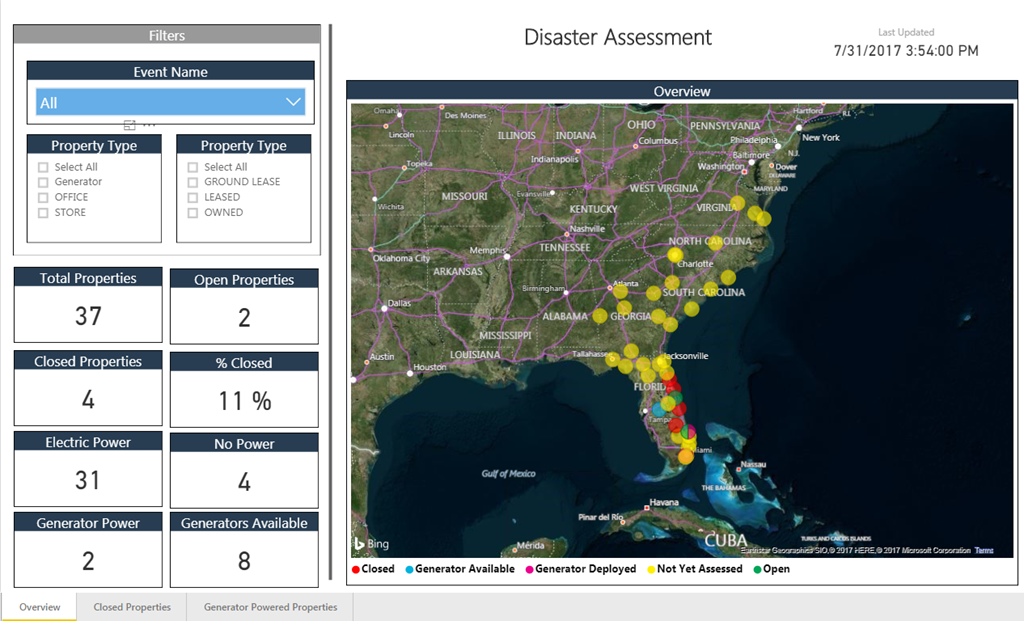
Real-World Dashboard for Disaster Monitoring / Planning / Acting
Intro from Rob: It’s all About Action!
Informing people is worthless.
When working with clients or students, I like to challenge them with this seemingly-controversial statement: Informing people is worthless.
Then I finish the thought: better analytics, reporting, etc. is only valuable when it translates into better actions, better decisions. And while better information is a pre-requisite for better action, it is hardly sufficient. “Better informed” very often does NOT translate into better action, for a variety of reasons. One reason is that you can give someone something that’s thought-provoking but fundamentally isn’t actionable. In my experience, at LEAST 50% of all reporting today has that problem, but there isn’t room to go into it here – check out our thoughts on Verblike Reports for more.
The other way that “information” fails to translate into action? When you lack a clear or convenient action PATH. If I see something that’s screaming for correction, for instance, if it’s not clear to me HOW I correct it (ex: who do I talk to? Which system do I need to adjust? Do I even have the right permissions to do so?), well, I’m dead in the water.
Taken that one step further, even if it IS clear to me where/how to take action, but it isn’t convenient – if it takes too much effort, or isn’t part of some overall systemic workflow, well, I can still be as “stuck” as above.
Closing the Action Loop with PowerApps and Flow
That’s why I’m so excited for Brad to share his recent project experience with us. Two new amazing tools from Microsoft – Flow and PowerApps – make it MUCH more achievable to quickly build relevant action paths and integrated workflows. They do for the “take action” part of the loop what Power BI does for the “inform and advise” portion.
[Flow and PowerApps] do for the “take action” part of the loop what Power BI does for the “inform and advise” portion.
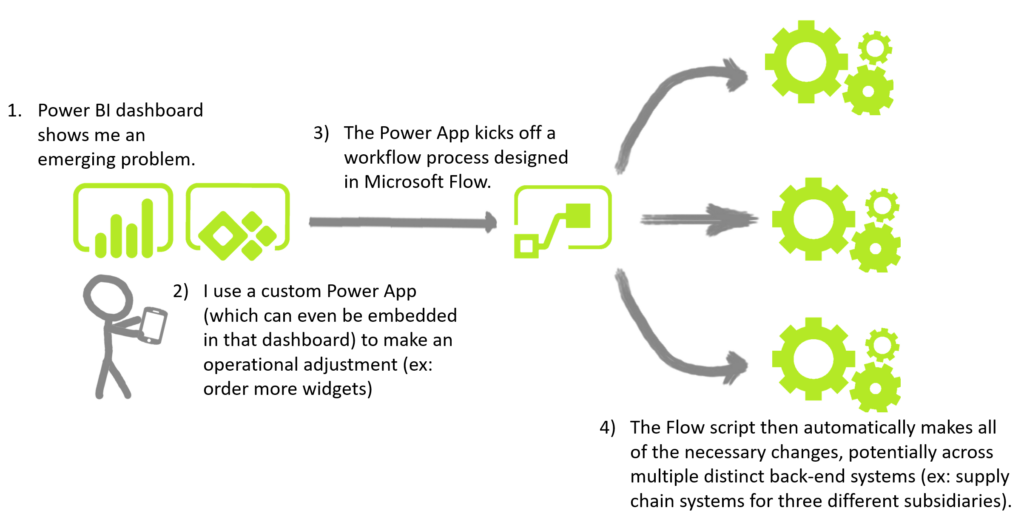
This is One Sample Workflow of Integration Power BI with Flow and PowerApps to Produce an Action Loop
(The workflow for the disaster center solution described in this article is different, and diagrammed later)
Over to Brad…
Let’s Start with PowerApps
PowerApps, generally available since November 1, 2016, is a platform to rapidly build web and mobile business applications without coding. Currently, PowerApps can only be shared inside an organization. I hear that sharing with users outside an organization is on the road map. Touted as “No-Code”, PowerApps enables building data driven apps that are device agnostic and can access a multitude of data sources, both cloud and on premise. What took months a couple of years ago, can now be accomplished in weeks. If your organization has Office 365 then you have PowerApps.
And Then There’s Flow
Microsoft Flow, released the same time as PowerApps, is a platform that enables automation of business processes through simple configurations. Things such as notifications, data collection, execution of stored procedures from apps, Twitter posts and Active Directory functions can be accomplished without writing code.There are dozens of pre-built templates to choose from that make adding Flows to your Power App solutions a breeze. Again, if you have Office 365 then you have Microsoft Flow.

Not “Flo.” It’s “Flow.”
And Power BI Needs No Introduction
But if you want one, this one is a great place to start. Short story, it is fast becoming the best and most popular BI tool on the planet and getting better every month. You *should* know that all these tools fit together. Here’s the Microsoft-required infographic which I kind of love – Measure, Act, Automate – pretty cool.
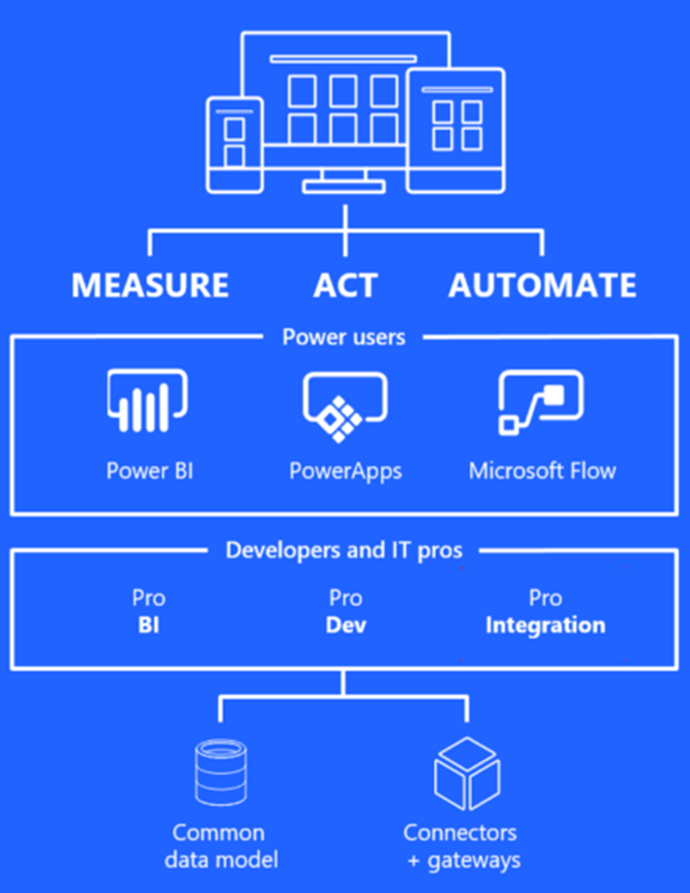
Measure, Act, Automate
And since we know you love stick figure diagrams, here’s another example of integrating the Power Trio (Power BI, Flow, and PowerApps) into a cohesive action loop:
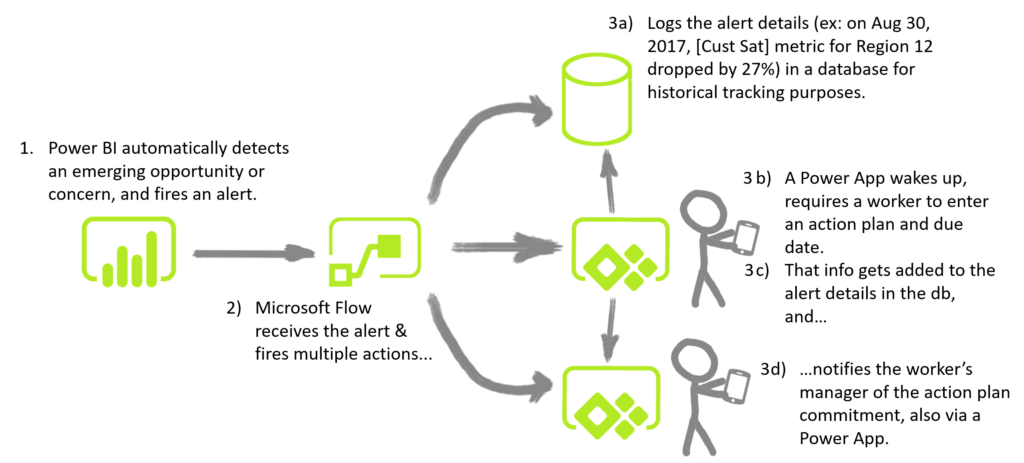
Here’s Another Sample Workflow Using the “Power Trio.”
(Imagine this kind of workflow for YOUR business – this kind of need is EVERYWHERE)
So… What’s the Problem?
One of our clients had a need to improve their disaster response process that was very manual and included phone calls, Excel lists and PowerPoint. This client has facilities spread across the eastern half of the U.S. When a flood, hurricane or other natural disaster happens, they go into “war room” mode for days to triage any damage to their facilities. Prioritizing issues so that these locations will be back up and open for business as soon as possible is key. Power outages, roof damage and flooding are tracked so that generators can be deployed or emergency work orders can be created to get things back up and running as quickly as possible.
Start At The End
It is often helpful to start at the end, so let’s do just that. Before we’re through, you’ll see how we created these Power BI Dashboards to provide the disaster response team immediate and up-to-date information on the status of properties affected by a major storm:
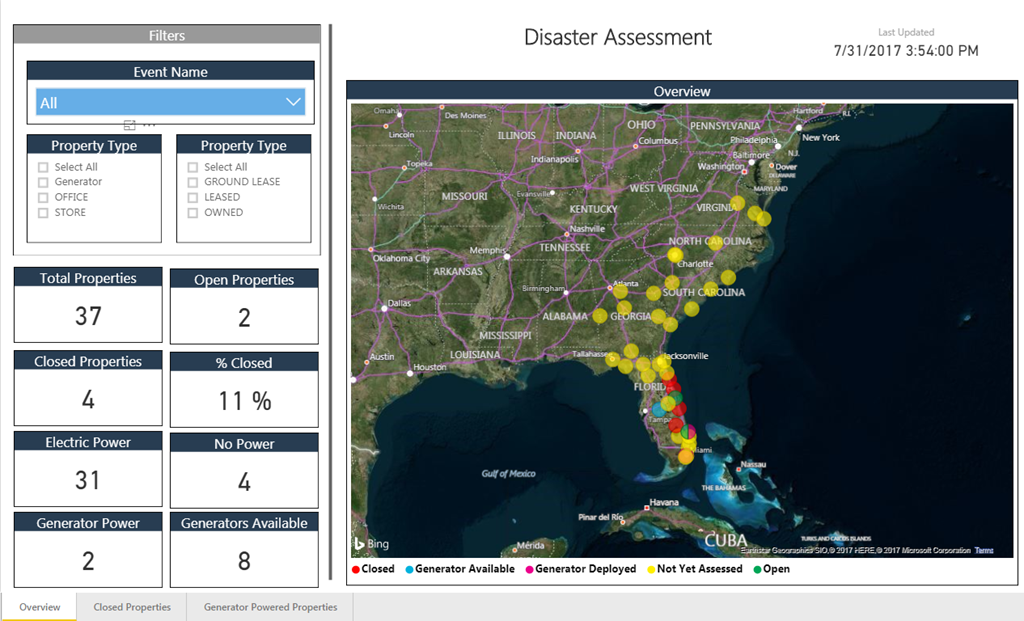
Power BI Dashboard to monitor storm damage and the status of their properties
Step One: A Storm is on the Way
As potentially dangerous weather events are forecast, the disaster response team keeps a close watch on the situation. When it seems imminent that a major storm is going to threaten areas where they have properties, the disaster response team begins preparation. They setup mission control and raise the alert status to Orange. This means the event is likely to impact their business.

There’s a storm a-comin’!
Step Two: Setup the Event and Determine Which Locations Could Be Impacted
The first of three PowerApps is now put to use. This app allows the disaster response team to setup the event and select what areas will likely be affected. When the team selects the states and counties in potential danger, this app uses Microsoft Flow to kick off background SQL processes that gather data from their enterprise systems and moves the key information into an Azure SQL database.
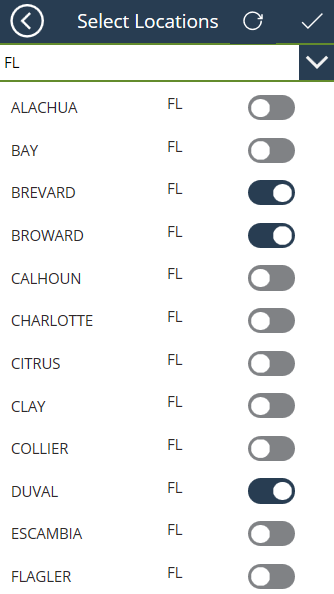
Power App to select areas likely affected
Step Three: Where are the Generators?
In situations like this, commercial power may be unavailable, leaving their properties in a closed condition. Generators need to be moved close enough to the disaster area where they can be deployed quickly. The second Power App allows the generator team to stage and track the fleet of generators and, when these generators are deployed, it helps them keep up with what properties they are supplying power to.

Power App to help manage fleet of generators
Step Four: Damage Assessment by Field Agents
As soon as the storm passes, field agents begin the process of assessing damage to their properties. Some of the key questions are:
- Is the location open or closed?
- Is commercial power available?
- Any flooding or roof damage?
They use the third Power App to do these assessments via their phone or tablet. As they update information about each property, the results are reflected real time back at mission control via the Power BI Dashboard. This enables the team to make quick, informed decisions.
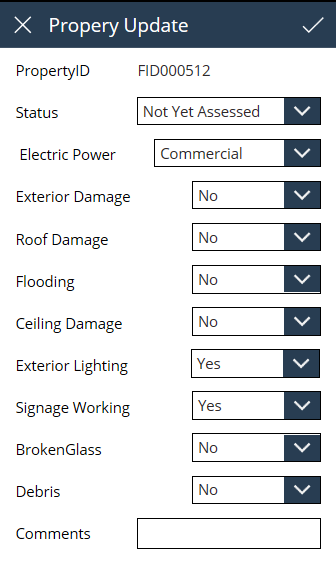
Power App used by field agents to update status of properties
Step Five: Monitor and Make Informed Decisions
The disaster assessment team can now make timely and informed business decisions using the Power BI dashboards and reports that are updated real time. This team now spends their time intelligently working to bring locations back online instead of spending their time assimilating information that is old by the time they report it.
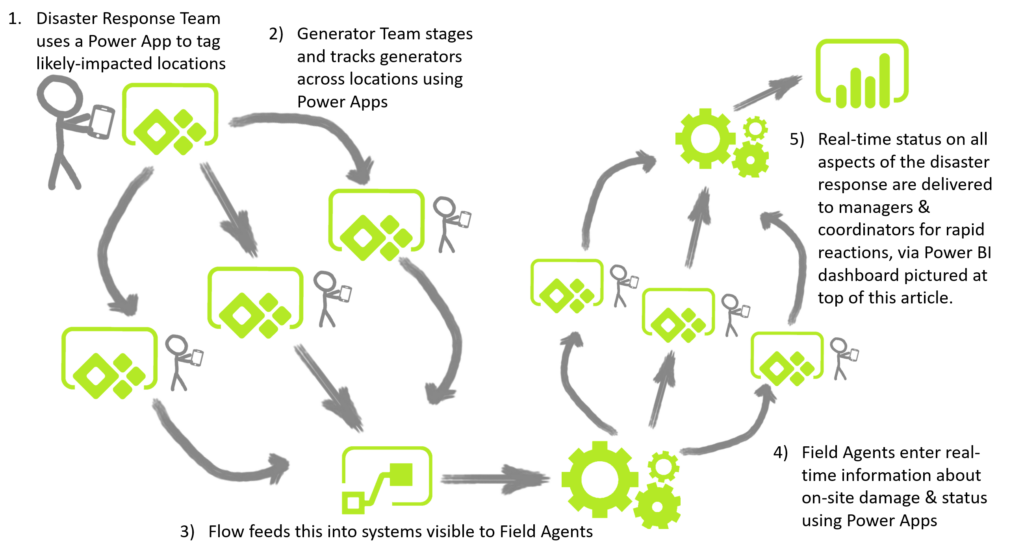
Finally, THIS Diagram Illustrates the Real-World Disaster Response Solution Described in this Article
Utilizing the “Power Trio”, this organization now has near-real time information at their fingertips from locations hundreds of miles apart, and they spend their valuable time in a much better way: getting their business back up and running as fast as possible! Power BI, coupled with Flow and PowerApps are poised to do some great things.
Power BI Embedded Dashboard
Are you saying “Wow, our company really needs something like this?”
You can close the loop and get action-oriented analytics developed a LOT faster than you’d expect. We’ll take you from zero to sixty and then some. Let’s get started.
Get in touch with a P3 team member