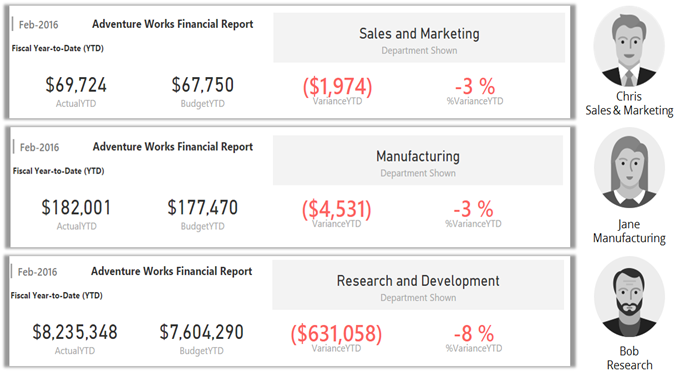
How can you deliver a centralized Power BI Dashboard to a large audience so that each audience segment sees a personalized/customized version of the Dashboard? Chris in Sales & Marketing only sees their own financial numbers. Jane in Manufacturing sees hers and Bob in Research sees his own numbers.
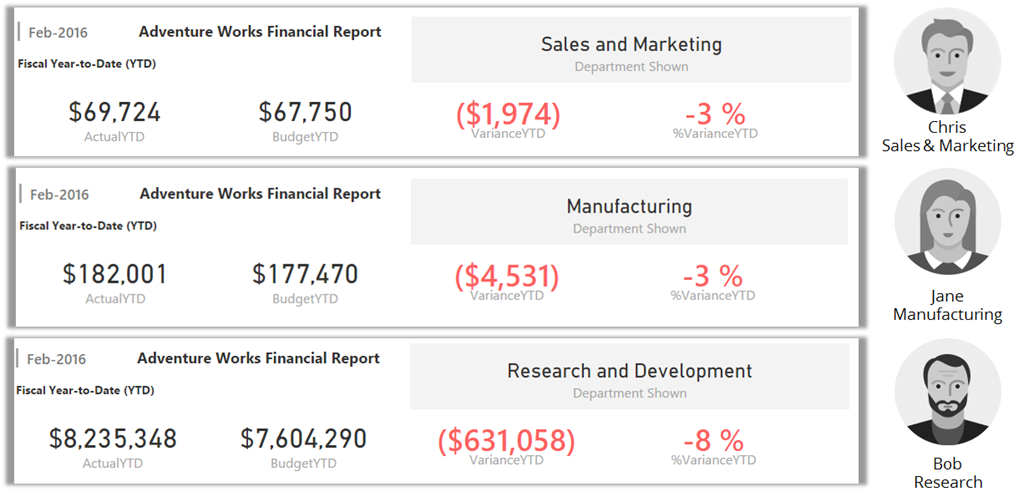
Each user sees their own Personalized Power BI Dashboard & Report
We faced this challenge when building a Financial Dashboard for one of our clients with a large user base. I covered this briefly in my Webinar (watch relevant section below), but wanted to go in more detail and outline the approaches we considered. Keep reading…
Watch relevant section from our Webinar Recording (Dashboard Personalization)
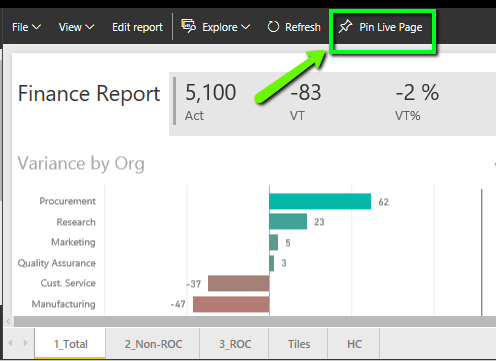
i. Pin Live Page
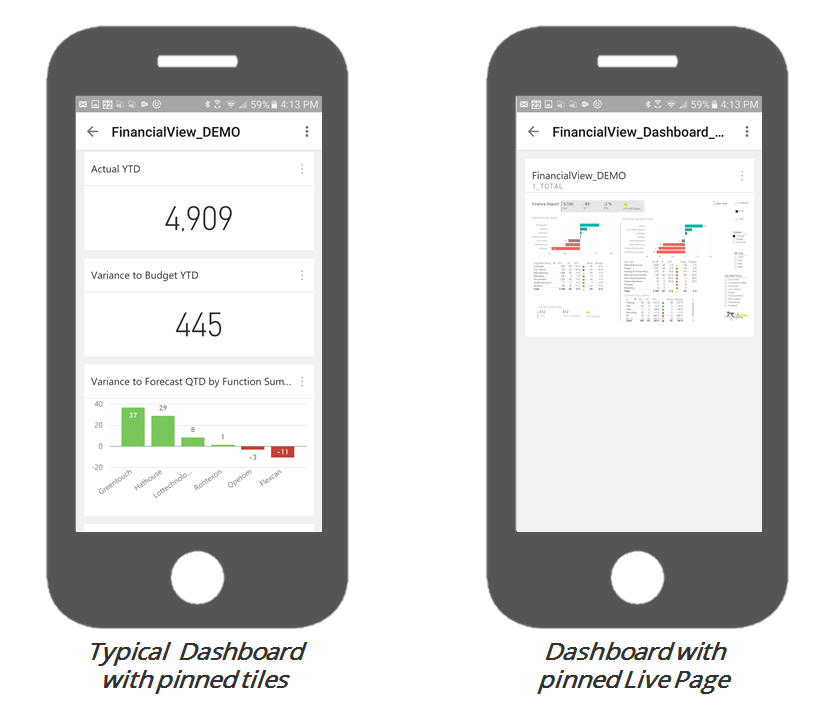
You can pin an entire Power BI report page to your dashboard. However, we chose not to go this route since this caused our dashboard not to render as beautifully on mobile devices.
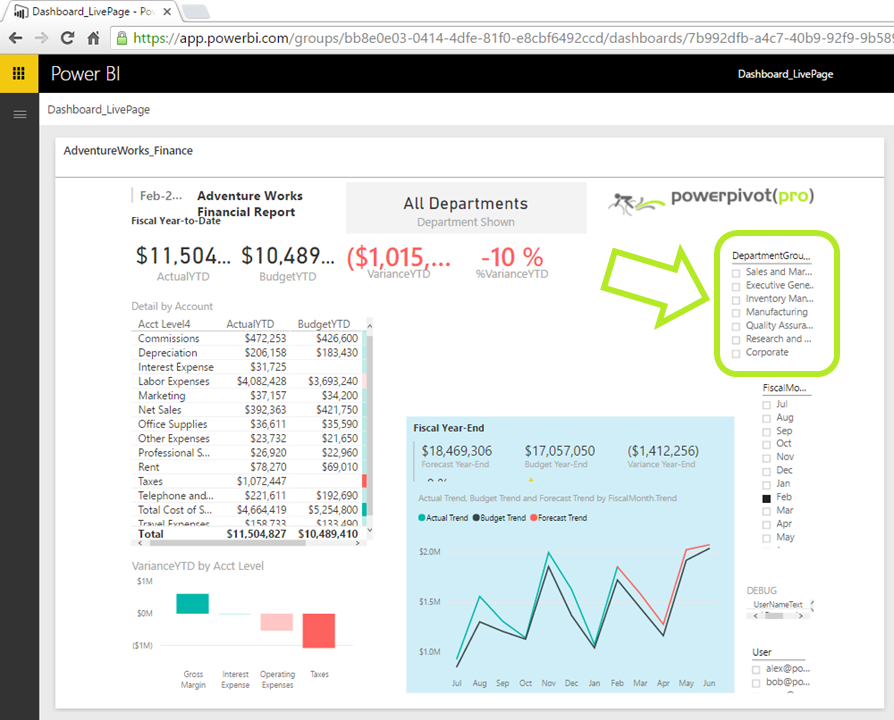
Even when viewing in browser, the Dashboard with Pinned Live Page does not look great. Results may vary.
Slicers are available right within Dashboard view though for one-click personalization
Pros:
- Easy to implement
- Changes to Report Page appear on the Dashboard*
* In the traditional approach where you pin individual elements, in which case changes to report are not reflected in the dashboard, e.g. if you change the chart type. The Pin Live Page, on the other hand would reflect any changes in the report directly to the Dashboard. This may appeal to some users based on their scenario.
Cons:
- Personalized view is still a click away 🙁
- Dashboard does not render as elegantly on Mobile
Typically on Mobile, Dashboard tiles are laid out automatically and quite elegantly. However, when pinning a Live Page, you pretty much see the page. See screenshots below.
ii. Copies of Dashboard
This is a brute force solution, but may work if you only have a few different audience segments you need to cater to. We would have had to create 50+ copies of the dashboard with different filters. Thus this option was not viable for us.
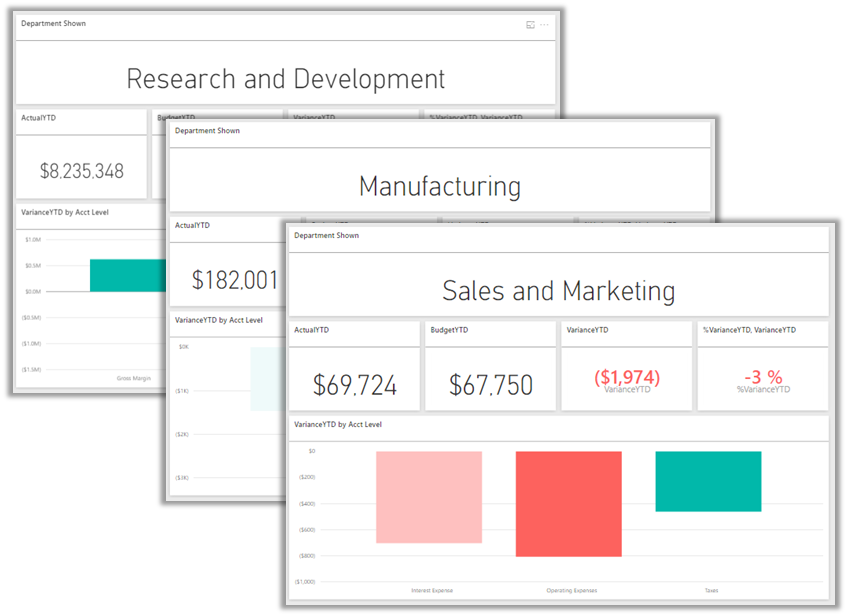
You could create copies/versions of the same Dashboard
(if the number of copies needed is not too large)
Pros:
- Somewhat Easy to implement
You still need to filter the report for each Dashboard and pin all the elements
Cons:
- Overhead to maintain
Each time you need a change on the Dashboard, now you have to make the same change in all the copies.
iii. Content Pack
Content Packs are a “self-help” solution. You let your users consume your Dataset/Reports and create their own personalized versions if they like. However for novice users and executive users alike, this involves way too many steps to be feasible. For our scenario, the content-pack approach felt like squeezing the bubble – simply pushing the complexity from our (Power BI Author) side to the User side. Powerful option, but not the right one for our scenario.
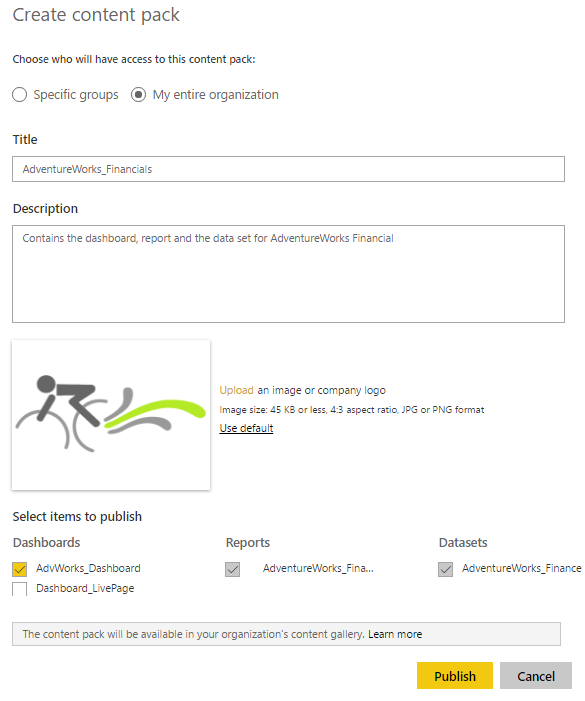
Creating and Publishing a Content Pack is easy, but you leave the heavy lifting for the end user
Pros:
- Simple to implement on the Author’s Side
- Advanced Users get free reign to customize and create their own reports and dashboards
Cons:
- Complex set of steps for end users to personalize their Dashboards
- No easy way for users who personalize their dashboards to merge new changes in the centralized dashboard
- Many users would need to repeat the steps to personalize their dashboards. This essentially decentralizes the creation and control of Dashboards. May be just what you’re looking for, but did not fit our needs
iv. Row Level Security
Row Level Security proved to be an effective approach for us to provide users a personalized view of their Dashboard & Reports based on the Organization they belonged to. The org hierarchy data was pulled directly from the Human Resource (HR) system, which allowed the Power BI Model to identify which user belonged to which department. In our sample data set, it looks as below.
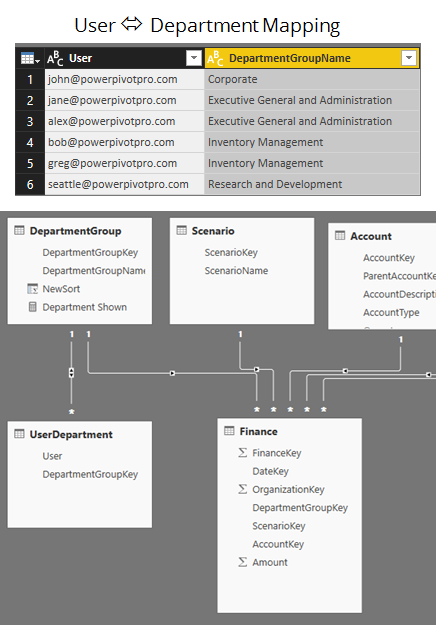
A simple User to Department mapping can be enforced via Row Level Security

Use Manage Roles to specify a role with Row Level Security defined
Here are some articles if you would like step-by-step details: Row Level Security with Power BI, Row Level Security with SSAS Tabular.
Pros:
- Dead simple to use on End-Users side. They don’t have to do a thing, when they load the Dashboard/Reports it’s automatically filtered based on their Org/Department.
Cons:
- Somewhat complex to setup
- If a system table cannot be used to assign users to segments, additional overhead to maintain it manually
Get in touch with a P3 team member