Guest Post by Colin Banfield [LinkedIn]
In September of last year, I posted two articles on creating percentile measures in DAX. See Creating Accurate Percentile Measures in DAX – Part I and Creating Accurate Percentile Measures in DAX – Part II. About three months after I posted Part I, Richard Mintz left a comment indicating that he was having trouble getting correct results when his data sets had a wide range of values and many duplicates. I haven’t been receiving notifications when comments are left, so it’s purely by chance that I saw Richard’s comment recently.
During the process of building the measures, I did do some testing with duplicates, but the testing was minimal and involved only duplicates at the 25th or 50th percentile mark.
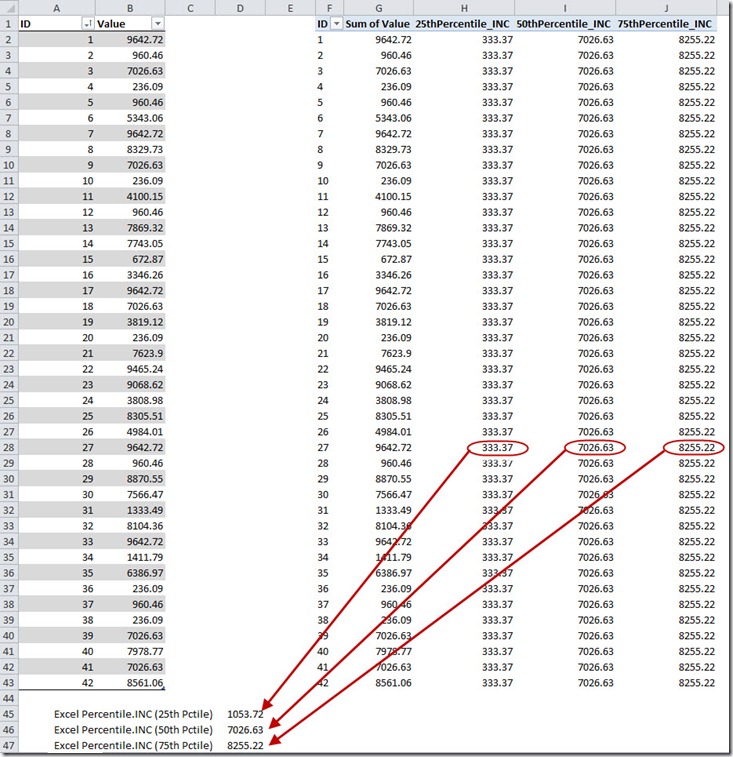
To check out the reported issue, I built a new data set with many duplicate values. Figure 1 shows the results of the percentile calculations in this scenario:

Figure 1
Huh? What’s going on here? The 50th and 75th percentile calculations are correct, but the 25th percentile calculation is totally and utterly incorrect! I created several intermediate measures along the way to the final result, so it was trivial to track down and correct the problem.
Recall for a moment how we calculate the percentile:
1) First we rank the data (Sum of Value) in ascending order.
2) We then determine the rank for given percentile, using the formula n=P(N-1)/100+1 (for percentiles inclusive), where n is the rank for a given percentile P, and N is the number of rows in the dataset. Let’s call this measure generically, PctRank.
3) The calculation in step 2 could result in a rank that’s a decimal value. Therefore, we find the data values corresponding the integer ranks below and above the calculated number from step 2. Let’s call these measures generically, PercentileDown and PercentileUp
4) We then interpolate to get the percentile numbers shown in Figure 1.
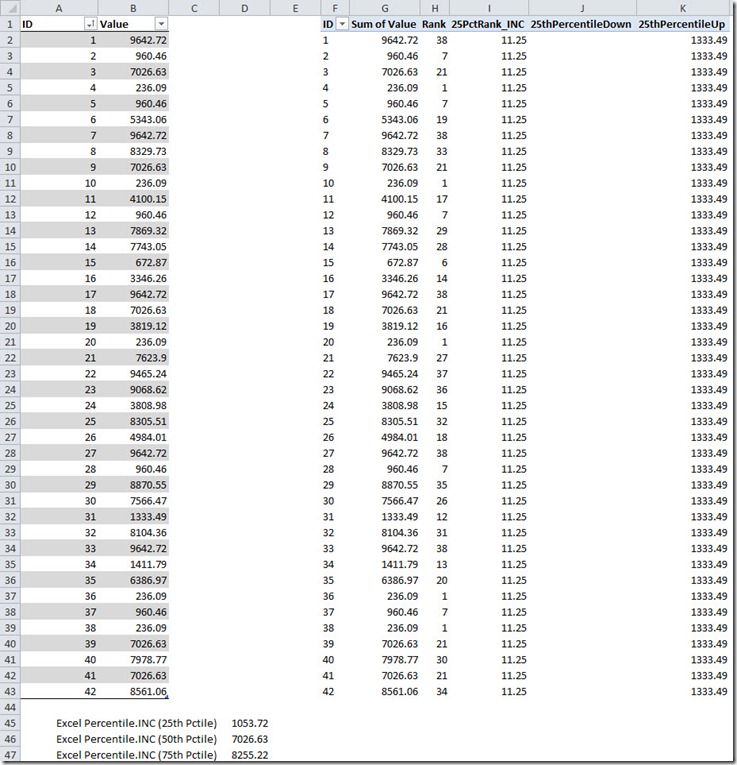
Figure 2 shows all of the intermediate formulas created for the 25th percentile, plus the Rank measure.

Figure 2
From Figure 2 you can see:
1) The 25th Percent rank is 11.25.
2) The 25thPercentileDown measure is empty!
The formula I used for PercentileDown was
=MAXX(
FILTER(
ALL(Data),
[Rank] = ROUNDDOWN( [25PctRank_INC], 0)
),
[Sum of Value]
)
The formula is filtering the data for [Rank] = 11. However, in Figure 2, there is no rank corresponding to 11, so the calculation returns blank. In Figure 1, we got correct calculations for the 50th and 75th percentile only because there were ranks corresponding to the 50thPercentileDown and 75thPercentileDown calculations. In other words, the correct calculations were a coincidence based on the specific data set – not the type of thing to inspire confidence in the technique.
What about the PercentileUp measures? They were correct in all cases because I used a different formula:
=MAXX(
TOPN(
ROUNDUP([25PctRank_INC],0),
ALL(Data),
[Sum of Value],1
),
[Sum of Value]
)
The situation is quite ironic. In my original post (Part I), I made the following statement:
“For 25thPercentileUp, you may be inclined to use a similar formula, substituting the ROUNDDOWN function for ROUNDUP [Ed. Here I’m referring to the formula I used for PercentileDown]. However, in the event of ties for the 25th percentile, the filter will be incorrect. This is so because [Rank] will calculate the same rank for ties (11 in this case), and ROUNDUP([25PctRank_INC],0)will be = 12. We can get around the problem by filtering the table using the TOPN function instead…”
And this was the extent of my pathetic testing with duplicates (ties). I completely overlooked the obvious situation shown in Figure 2, where you can have significant skips in the rank numbering, and depending on the data set, the rank number that the formula is looking for may not be present. This oversight is phenomenally glaring.
Anyway, the solution to the PercentileDown is to simply use a formula similar to the one we for PercentileUp. So the 25thPercentileDown formula now becomes:
=MAXX(
TOPN(
ROUNDDOWN([25PctRank_INC],0),
ALL(Data),
[Sum of Value],1
),
[Sum of Value]
)
And similar corrections must be made for the 50thPercentileDowm and 75thPercentileDown measures.
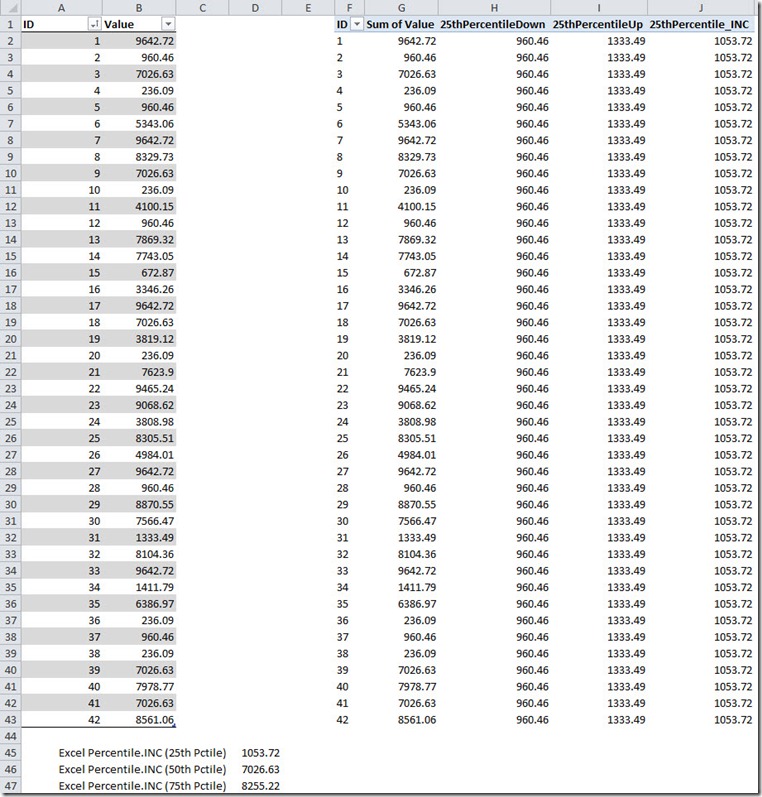
TOPN returns the top 11 values (the result of ROUNDDOWN(11.25,0), with ties. In the data set shown in Figures 1 & 2, the top 11 values include all of the data from the 1st to the 7th rank (inclusive). MAXX returns the largest value in the TOPN set, which in this case is 960.46. The corrected calculations are shown in Figure 3:

Figure 3
Thanks again to Richard for pointing out the problem.
Note: Another commenter, Trevor Carnahan, suggested using ALLSELECTED() instead of ALL(), which I’ve used in my formulas. ALLSELECTED() is particularly useful if you have slicers, and want to take the slicers’ filter contexts into consideration, while removing the filter contexts from the PivotTable rows and columns.
Get in touch with a P3 team member