
Today, we’re diving into something that’s about to change the game for mobile data in manufacturing. I’m talking about Power BI’s pane manager, and trust me, it’s not just another fancy feature—it’s the secret sauce your mobile data strategy has been craving. Let’s explore how this tool is not only optimizing mobile views but is directly impacting production efficiency and decision-making in real-time, revolutionizing how we approach manufacturing data analytics.
What is Pane Manager in Power BI?
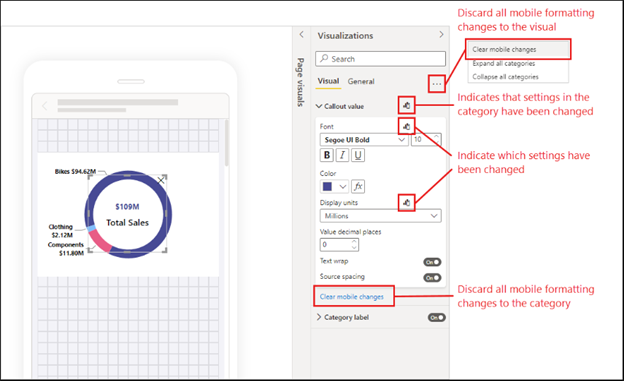
Power BI’s pane manager is a powerful feature designed to optimize the mobile viewing experience for Power BI dashboards and reports. It allows users to create custom layouts specifically tailored for mobile devices, ensuring that data is presented in a clear, concise, and easily navigable format on smaller screens. The pane manager enables report creators to control which visuals are displayed, how they’re arranged, and how users interact with them on mobile devices, without impacting the desktop version of the report.
With the pane manager, you can organize content into logical sections or “panes” that mobile users can swipe through, providing a more intuitive and touch-friendly interface. This feature addresses the challenges of displaying complex dashboards on mobile devices by allowing for the prioritization of key metrics and the creation of a streamlined, mobile-first design. By leveraging the pane manager, organizations can ensure that their critical data is accessible and actionable for users on the go, significantly enhancing the mobile BI experience in environments like manufacturing where real-time, on-the-floor data access is crucial.
The Mobile Data Dilemma
We’ve all been there—you’re out on the factory floor, and suddenly you need to check those production numbers from last week. What happens next? You either struggle with a dashboard that’s cluttered and difficult to read, or you trek back to your desk, wasting precious time. It’s frustrating, inefficient, and frankly, its holding your manufacturing data analytics back.
Having access to your data on the go isn’t just a convenience; surprisingly, very few manufacturers are leveraging their supply chain data effectively. In fact, even with multi-million dollar capital investments, the industry seems to be moving backward when it comes to utilizing this critical information. This is where Power BI’s pane manager steps in, transforming your mobile data from a frustrating challenge into a powerful asset.
Mobile Dashboards That Actually Make Sense
Imagine pulling out your phone and immediately seeing the data you need, no pinching or zooming required. With the pane manager, it’s not just shrinking your desktop view and calling it a day. It’s a complete mobile makeover that puts your key metrics front and center, perfectly sized for your screen.
Navigate Your Data with Ease, Even on a Small Screen
Forget the endless scrolling, trying to find that one crucial metric on your phone. The pane manager organizes your data into logical, easy-to-navigate sections that actually make sense on a small screen. This means less time searching and more time acting on insights.
Prioritizing What Matters Most
In manufacturing, every second counts. A delay in accessing critical data can mean the difference between efficiency and operational delays. The pane manager’s ability to prioritize key metrics is significant. Production rates, quality control stats, inventory levels, machine performance—all accessible with a single tap, providing not just data, but context, trend highlighting, and anomaly flagging.
A User Experience That Engages Your Team
If accessing data on mobile devices is cumbersome, you’re missing out on a ton of potential. The pane manager crafts an experience that’s not just about displaying information on a small screen; it’s about creating an experience that’s easy AND enjoyable to use. Clear labels, intuitive icons, smart use of color—it all comes together to create dashboards that your team will want to engage with, encouraging better decisions and driving your business forward.
Real-Time Updates That Keep You in the Loop
With pane manager, you’re putting alerts and real-time updates front and center on your mobile dashboards. Get instant notifications for machine malfunctions, quality control issues, or inventory shortages, all delivered in a clear, actionable format right to your phone. That’s the kind of real-time insight that can prevent small issues from becoming big problems.
Your New Mobile Data Strategy
Power BI’s pane manager is an opportunity to develop a new way of thinking about manufacturing data analytics on the go. By creating tailored mobile dashboards, simplifying navigation, prioritizing critical metrics, enhancing user experience, and enabling real-time updates, the pane manager transforms mobile manufacturing data analytics from a necessary evil into a genuine asset for your operations. This tool doesn’t just make data accessible; it makes it actionable, turning every mobile device into a powerful hub for manufacturing intelligence.
Ready to Take Your Mobile Data to the Next Level?
If you’re excited about the possibilities (and you should be), it’s time to take action. While implementing pane manager effectively requires some experience, the payoff is substantial. Here at P3 Adaptive, we’re passionate about turning data challenges into data opportunities and we’d love to show you how to leverage Power BI and tools like pane manager to modernize your data strategy.
So, what do you say? Are you ready to change how you handle mobile data in your manufacturing operations? Let’s make your data work for you, wherever you are. Reach out to us, and let’s start this mobile data revolution together.
Get in touch with a P3 team member