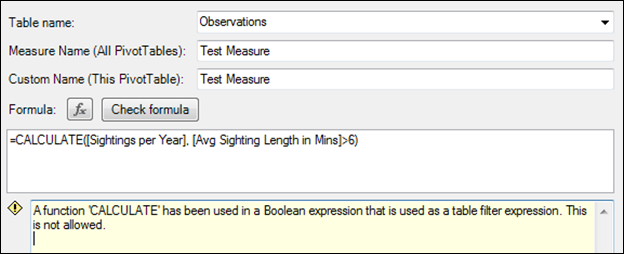
A recent comment/question alerted me to the fact that I’ve never devoted a post just to this very useful (and often misunderstood) function. Time to correct that.
The #1 Reason to Use FILTER – When CALCULATE Breaks Down

Does this Mysterious Error Look Familiar?\

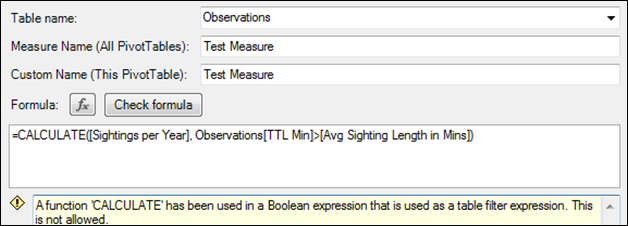
Different Formula, Same Error
What’s Wrong With Those Formulas?
The thing both of those formulas have in common is that they are using a measure in the filter argument of the CALCULATE function. In both examples here, I’ve highlighted the offending measure in yellow.
CALCULATE([Sightings per Year], [Avg Sighting Length in Mins]>6)
CALCULATE([Sightings per Year],
Observations[TTL Min]>[Avg Sighting Length in Mins])
In the first formula, I was trying to use a measure on the left side of the comparison, and in the second, I was trying to use a measure on the right side of the comparison. Both are illegal.
CALCULATE expects its filter arguments to take the form of Column=Fixed Value, or >Fixed Value, <= Fixed Value, etc., where “Fixed Value” is a specific number (like 6), a specific text string (like “Regular”), or a specific date. So my first formula violates the rule that a column name is required on the left. And my second formula violates the rule where a fixed value (not an expression or a measure) is required on the right.
CALCULATE refuses to let you use variable expressions like measures in these filter arguments largely because “vanilla” CALCULATE is intended to always be fast, and once you start including expressions in these comparisons, your formulas might run a LOT slower. So this is a good rule really – it forces you to stop and think before accidentally doing something bad. The error message, of course, could and should be a lot better.
For a bit more explanation on this, see this brief post.
What’s the Solution?
If you look at those two illegal formulas above, they both reflect a perfectly valid intent. The first formula is attempting to ask for “how many sightings per year would I report if we just counted sightings that lasted more than 6 minutes” and the second is asking for “how many sightings per year are above average in length.”
I’m almost regretting my selection of those examples because they are a bit more complex than necessary to make the fundamental points. But hey, too late now to change them, so I’ll move quickly.
In the first example, the Avg Sighting Length measure is actually based on a column in my Observations table – each UFO sighting has a [TTL Min] column. So I could rewrite that filter in the calculate as Observations[TTL Min] > 6 and everything is fixed.
But let’s say I wanted to filter out entire States where the average sighting length was > 6. Since I don’t have a column in my States table that does that, it’s sensible to use the measure, and that forces me to use FILTER because FILTER does allow me to use measures in my comparisons:
CALCULATE([Sightings per Year],
FILTER(States, [Avg Sighting Length in Mins]>6)
)
See that? The highlighted section took one of the filter arguments to CALCULATE and replaced it with a call to the FILTER function. The syntax of FILTER is pretty simple but is explained below.
In my second example, where a measure was used on the right side of the comparison, the formula gets rewritten as:
CALCULATE([Sightings per Year],
FILTER(Observations,
Observations[TTL Min]>[Avg Sighting Length in Mins]
)
)
So there you go. When you want to use a measure, or an expression like AVERAGE(Observations[TTL Mins]), you have to call in the FILTER function. More details follow, starting with the simplest information and moving to the most subtle of characteristics.
How does FILTER() Work?
The syntax for the FILTER function is FILTER(TableToFilter, FilterExpression). Pretty simple.
For simple purposes, if you understand the gist of the above, and then points 1 and 2 below, you are good to go. If you want to understand more of the details over time, I recommend revisiting points 3-5.
- FILTER() takes a TableToFilter and a FilterExpression and returns all rows from that TableToFilter that match the FilterExpression.
- In the example above, TableToFilter is ALL(Periods)
- and FilterExpression is Periods[Year]=MAX(Periods[Year])-1
- FILTER() steps through the TableToFilter one row at a time.
- And for each row, it evaluates the FilterExpression. If the expression evaluates to true, the row is “kept.” If not, it is filtered out.
- Because FILTER() goes one row at a time, it can be quite slow if you use it against a large table. When I say “large” that is, of course, subjective. A few thousand rows are fine in my experience. A million is not. Do not use FILTER() against your fact table.
- The FilterExpression typically takes the form of Table[Column] = <expression>
- The comparison operator doesn’t have to be “=.” It can also be <, >, <=, >=, <>
- The expression on the right-hand side of FilterExpression can be “rich.” This is VERY useful. In a simple CALCULATE, the right side of each filter expression has to be simple, like a literal number (9) or a string (“Standard”). The fact that FILTER() allows for rich expressions here is one of the most common reasons I use FILTER().
- The Table[Column] in the filter expression is a column in the TableToFilter. If you are filtering the Periods table, it makes sense that you are testing some property of each row in Periods. I can’t think of a sensible reason to use a column here that is NOT from TableToFilter. (Insert “boot signal” here, maybe the Italians can address this).
- FILTER() ignores everything else going on in your formula and acts completely on its own.
- For example, our overall formula sets ALL(Periods) as the first argument to CALCULATE.
- The FILTER()’s that come after that do NOT pay any attention to other arguments, however, including that ALL(Periods).
- In other words, the FILTER() functions are still operating against the original filter context from the pivot! If the pivot is sliced to Year=2009, then the FILTER() function starts with the Periods table already pre-filtered to just 2009.
- This is why each of my FILTER()’s uses ALL(Periods) for TableToFilter. I have to repeat the “expand” step so that my FILTER() is also working from a clean slate.
- Even though each FILTER() operates on its own, their results then “stack up” in the overall formula.
- Even though FILTER() RETURNS a set of rows that matched the FilterExpression, it actually REMOVES rows from the overall filter context.
- This sounds tricky, but really, it isn’t.
- Let’s say our TableToFilter contains 6 rows: A, B, C, D, E, and F.
- And our overall formula contains two FILTER() clauses that both operate on the same TableToFilter, just like our overall formula near the beginning of this post.
- Let’s also say that the first FILTER() returns rows A, B, C, and D.
- And the second FILTER() returns rows C, D, E, and F.
- The net result is that only rows C and D are left “alive” in the overall filter context of the formula.
- So one way to think of this is that FILTER()s “stack up” on top of each other.
- Another way to think of it is that even though the first filter RETURNED rows A, B, C, and D, its real effect was to REMOVE all other rows (E and F) from consideration.
Get in touch with a P3 team member