“Because every good story has a beginning, a middle, and an end.”
Awhile back I posted about promotional campaign analysis factoring in seasonal trends. Now let’s look at another flavor of campaign analysis: comparing results when a campaign is active versus when it was not. Sometimes this is referred to as “A/B Testing.”
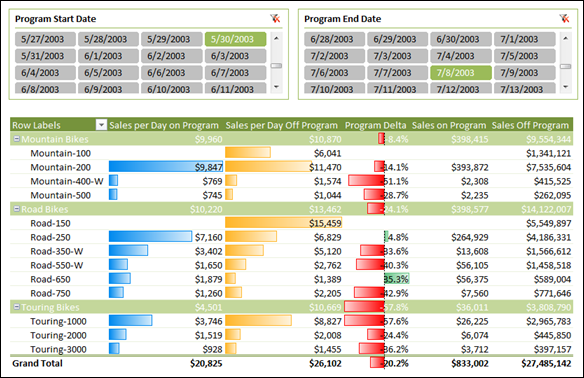
Let’s start by showing what the results can look like: a report that has two date slicers – one where you select the Start Date of a campaign, and another where you select the End date:
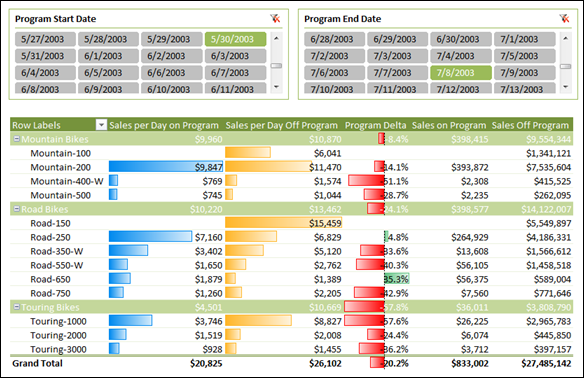
Pick Start and End Date, See How Sales Performed On vs. Off Program
The report then shows Sales results “On Program,” which are the sales that occurred between the start date and end date (inclusive) versus the Sales results “Off Program” (sales on all other dates).
Specifically, it shows Sales per Day for On vs. Off Program (because programs run for short periods of time, Sales per Day is a much more “apples to apples” comparison than Total Sales), and then the % change in Sales per Day when On Program versus Off (labeled “Program Delta” above).
(From a quick glance at Program Delta, it’s obvious that this was one awful program that ran from 5/20/03 to 7/8/03, but hey, that’s what we get when we use AdventureWorks as our data set).
Oh, and guess what? Writing this blog post consumed a lot more time than building the report 🙂
How This Was Built, Step One: Date Slicers and Date Measures
The first things you need are two single-column tables of dates – these are used to populate the Start and End date slicers:


These tables are NOT related to ANY other tables in the model. They stand alone, intentionally. Also, MAKE SURE THEY ARE OF DATA TYPE DATE! Otherwise the following steps will give you strange results. Also, make sure none of the date columns in your model have time components lurking in them.
OK, now you need to define a measure on each of those two tables. It’s the same formula, but I name one [Start Date] and the other [End Date], and assign each one to a different table:
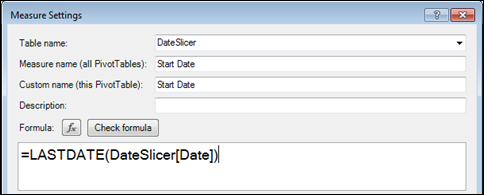
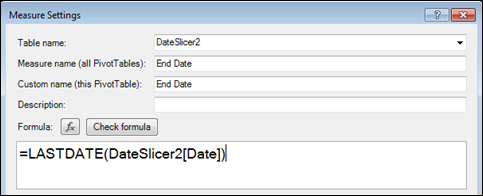
By the way, the technique I’m showing here is a variation of a technique covered in prior blog posts: one by Kasper and one by me. Read Kasper’s in particular if I’m moving a little too fast for your taste in this post.
For grins (and to test this out), you can now slap both slicers and both measures on a pivot and inspect what each of those measures returns:

We’ll never place those measures on an actual report, but it’s good to see that they serve their purpose, which is to capture the dates that the user selects on the two slicers. Note that I changed the captions on each slicer to reflect what their intended use is clear (originally they both just had “Date” as a caption since that was the column name in each table).
Step Two: Sales Measures that are filtered by those Date Measures
Assuming we already have our base [Sales] measure defined, let’s start with [Sales on Program]:
[Sales on Program] = [Sales](DATESBETWEEN(Dates[FullDate],
[Start Date],[End Date]))
We’re using the DATESBETWEEN function as a means of filtering our base [Sales] measure, and the [Start Date] and [End Date] measures that we defined previously are the end dates.
Note the use of the Dates table in the formula. That is a third Date table, separate from the two slicer date tables, and that table IS related to the Sales table.
So… we are picking up the user’s date selections from two tables that are NOT related to anything, and using the dates they selected to filter the “real” Dates table. That filter then gets applied to the Sales table because it is related to the Sales table.
[Sales Off Program] is a bit trickier than “On” Program. I suppose we COULD just subtract “On Program” sales from total [Sales], but just in case someday we need to build some date sensitivity into the base [Sales] measure, let’s defined [Sales Off Program] to be [Sales] filtered to dates OUTSIDE of the selected date range:
[Sales Off Program] = [Sales](FILTER(Dates,
Dates[FullDate]<[Start Date] ||
Dates[FullDate]>[End Date]))
First, notice that we are using the FILTER function this time rather than DATESBETWEEN. There is no DATESNOTBETWEEN or DATESOUTSIDE function, so we have to express the logic more directly ourselves. But that’s not a big deal – I’m pretty sure that DATESBETWEEN is really just a “skin” over the FILTER function anyway – I’ve used FILTER and DATESBETWEEN somewhat interchangeably over the past year and I always get the same results (and the same performance).
Also note the use of the “||” operator, also known as OR. Rows from the Dates table are included if they are before the [Start Date] OR after the [End Date].
One more note: you always want to use FILTER and DATESBETWEEN against the smallest tables you can. Use them against your Dates table, for instance, rather than against the Date column in your Sales table, because they are MUCH slower against larger tables.
Here’s what we get with those new measures on our pivot, and with some Product hierarchy on rows:
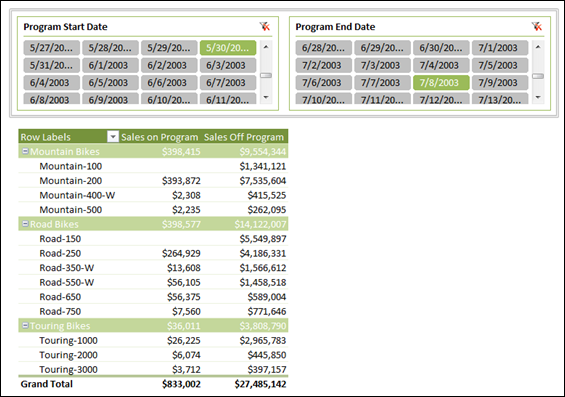
Now you see why “per day” versions of these measures are required – the programs are so short that they are dwarfed by the “off” dates.
Note: These two date slicers are great candidates for disabling cross-filtering and thereby improving the performance (update time) of this report. See this blog post for an explanation.
Step Three: Creating the Sales-Per-Day Measures
OK, first we need a [Day Count] measure that we can use as a denominator:
[Day Count] = COUNTROWS(DISTINCT(Sales[OrderDate]))
(Note that I am explicitly counting the Date column from the Sales table rather than the Dates table to account for product lines that did not exist for the duration of the entire Dates table, and therefore did not sell at all – there are tradeoffs here that I won’t go into, but I think this is the right thing to do in most cases when calculating a per-day measure).
[Sales per Day], then, is straightforward:
[Sales per Day] = [Sales] / [DayCount]
Now I need to create “On Program” and “Off Program” versions of that measure. These formulas parallel the On/Off Sales measures from above:
[Sales per Day on Program] = [Sales per Day]
(DATESBETWEEN(Dates[FullDate],
[Start Date],[End Date]))
[Sales per Day Off Program] = [Sales per Day]
(FILTER(Dates,
Dates[FullDate]<[Start Date] ||
Dates[FullDate]>[End Date]))
And lastly, let’s add the [Program Delta] measure, which is really Pct Change in Sales Per Day:
[Program Delta] = IF([Sales per Day on Program]=0,BLANK(),
([Sales per Day On Program] – [Sales per Day Off Program])/
[Sales per Day off Program])
The IF in there is just to catch the case where a product did not sell during the selected dates. If I leave that IF out, the measure will return –100% for those cases. Sometimes that is what you want and sometimes it is not – it’s a case by case judgment.
Add some conditional formatting, and here’s the resulting report, repeated again from above:
Alternate Approach: Using a Promotions Table
Rather than use two date slicers like we have here, you COULD have a single Promotions table that lists each promotion and its Start and End date. Something like this:
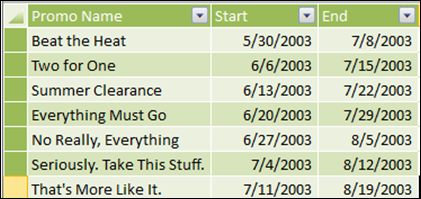
Now, I just have to go back to my [Start Date] and [End Date] measures and change their definitions to reference the Start and End columns in this table, and “attach” them to this table instead of those slicer tables:
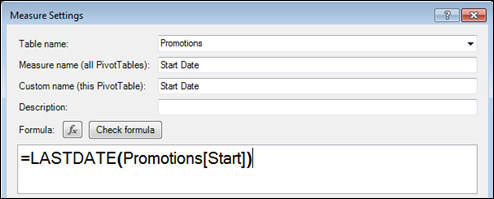
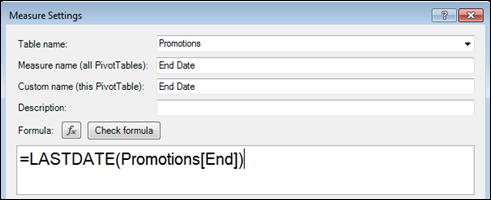
I don’t have to make ANY other changes. Now I can remove the Start and End date slicers, and replace them with a single Promo Name slicer:

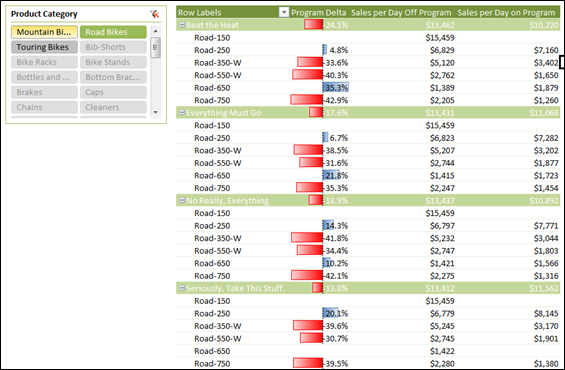
Or, move Promo Name to Rows and some of the product stuff to slicers:
Other Fun Stuff
There are many, MANY other things you can do here too. For instance, a measure that calculates sales per day for the month leading up to a promotion starting. Or the month after it ends. Or the exact same period 1 year ago. PowerPivot truly does open doors that you’d never consider in traditional Excel (and probably would never get to in traditional BI).
Get in touch with a P3 team member