Resuming from Last Week
Last week’s post left off here: most BI still relies on the storage layer (SQL or its many cousins) to be the brain, and storage layers are terrible brains because they were designed for storage, not for analysis.
This week, I hope to explain the following points:
- Storage brains are siloed brains.
- Storage brains are slow – in two ways.
- Using Power BI doesn’t help much unless you use it properly
Let’s “tease” point #3 real quick…
It’s kind of a shame that the narrative flow “buries” point 3 near the end, so let’s give you a preview of that right here, up front, before circling back to the sequential agenda.
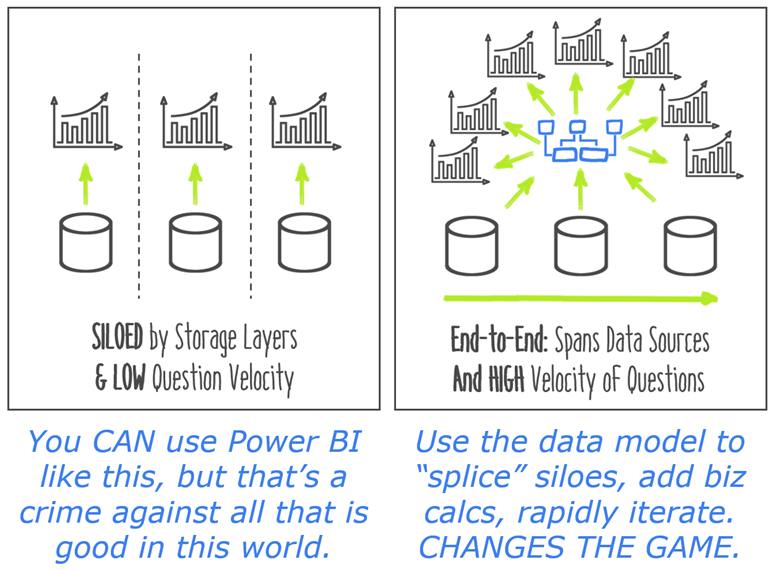
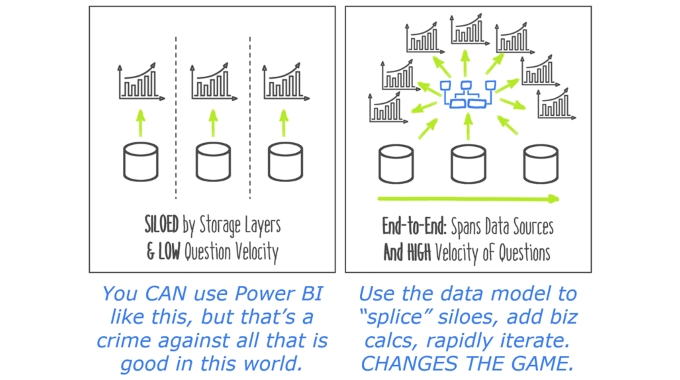
In last week’s article, I talked about the rise of the dumb reporting tools – the ones that depend on the storage layer to be the “brain.” Power BI is very, very different. It’s SMART. It has its own brain (called the Data Model, among other names).
But in order to be a smart tool, FIRST it ALSO has to have everything the dumb tools had! You still need to be able to draw charts and tables with your data, which is the core capability of the brainless reporting tools.
And that sets a trap. Power BI offers an amazing superset of what the brainless tools could do, BUT… you can absolutely still use it like the dumb tools.
We’ll circle back to this. Now let’s go talk in detail about why SQL (and storage systems in general) are terrible brains for analysis, reporting, and BI in general.
1) Storage brains are siloed brains.
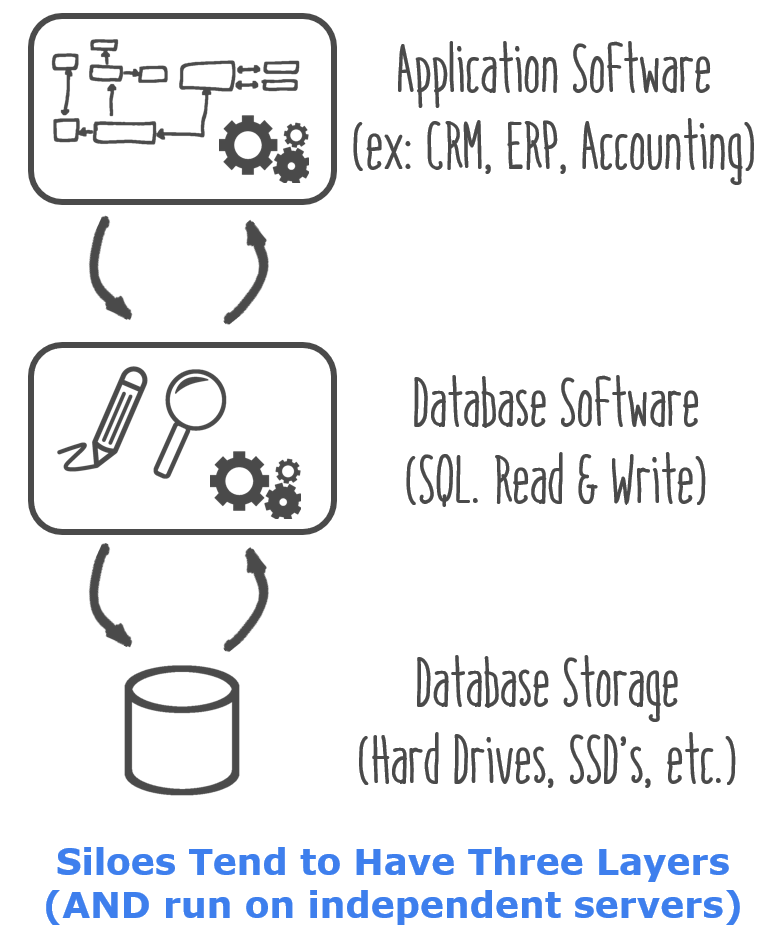
Enterprise and Line of Business server applications don’t like to share. For good reasons, it’s best to run them on different servers, with separate storage systems underneath each one. So if we look inside one of these “siloes” for a moment, it looks a little bit like the figure here.
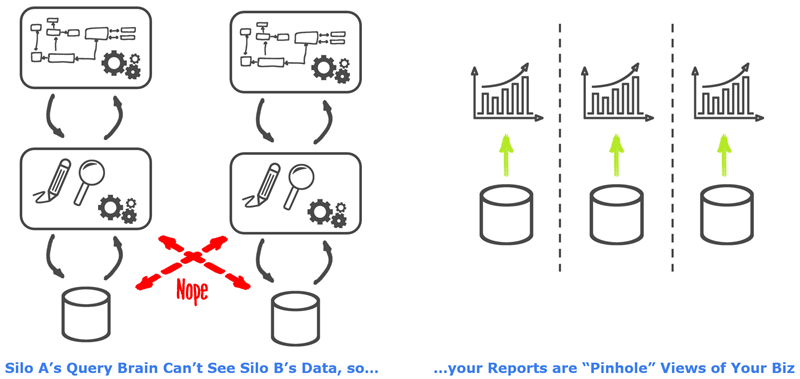
Because each application “owns” its respective storage layer, there’s no single database you can ask questions of. The database brain underneath Application A (CRM, for instance) has zero access to the stored data in Application B’s storage. The database software, and the machine it runs on, is inherently tightly coupled to its disks.
But even in cases where the storage is less tightly-coupled, and Database A can see the data in Database B, it won’t know what to do with it. The storage schemas are completely different, id’s and keys are incompatible, etc.
So every single system in your organization EXCLUSIVELY spews out reports from its OWN domain. Since you can’t run SQL queries over data that is stored elsewhere, your CRM gives you reports about… CRM stuff. Your accounting system gives you your current financials. HR system gives you a view of your people. And you’ve got MANY line-of-business systems, each giving you snapshots of what’s going on in those individual siloes.
Oh, you need to see a more integrated, end to end view of your company’s performance? Tough luck. Here’s a hundred different reports. Happy hunting!
“Fine, just unify the databases into one!”

“Just wait for the Enterprise Data Warehouse!” “We’ll get everything loaded into a single storage system ANY DAY NOW. And then we’ll be able to use SQL across the siloes! Finally, we will have visibility!” Yeah, cough cough, sure.
This is one of the all-time “howlers” – a lie so big, no one believes it can BE a lie. And like all good lies, it starts with truths. First, yes, of COURSE it’s a good idea to create a copy of your applications’ data, and use the COPY for all of your BI needs rather than directly querying the original underlying storages. Second, of COURSE it’s a good idea to be storing point-in-time snapshots of your data, since the application systems only really care about “today,” and will happily forget important details from yesterday (or five years ago). And finally, of COURSE if you’re ever going to have end-to-end, cross-silo visibility into your data, you have to unify your keys/identifiers/schemas, so that all of the data speaks the same dialect (ex: all the data “agrees” on what a customer id looks like).

Those are all Good Things, and they should always be in progress. We do this stuff for a living, at organizations ranging from mid-market to the Fortune 100, and we absolutely LOVE it when there’s a good data warehouse waiting for us! But there are problems, the most obvious of which is the “wait for it” part. The Enterprise Data Warehouse (EDW) is never “caught up” with the proliferation of systems and relevant data sources. You can add a single LOB application to your organization MUCH faster than you can onboard its data into the EDW. So even in organizations which HAVE a strong EDW in place, 20-40% of the “important” data is still not yet captured in said EDW.
Of course, even if you DID somehow get the EDW “caught up,” you’d still have to deal with the Slow problem. That sounds a lot like a transition to the next section, doesn’t it? Well, it is.
2) Storage brains are Slow – in two ways.
First of all, storage brains are slow to RUN useful business queries. Since storage brains have to be concerned about the tiniest little individual details (like, a single row) AND they have to be able to update/write to ANY individual row at any time, they can’t be properly optimized for speed when it comes to aggregate-level queries. Aggregate queries are basically the bread and butter of the business – we don’t care (usually) about a single transaction, but instead care primarily about trends and totals (even though those trends and totals themselves CAN get pretty “drilled down,” which we will see in a moment).
To illustrate this point when I was speaking at a recent Developers conference, I created the following data set. Three different tables, simulating 1) an organization’s digital advertising data (say, from Facebook or Google) 2) their website visitor tracking and 3) their e-commerce system. Three consecutive steps of the digital funnel, in other words. And all definitely tracked by different operational systems.

Left to Right: Ad Display Data, Website Data, and eCommerce Transactions
(Roughly 10% of our Ad Impressions Yielded Clicks to Our Site, and 10% of Those Visitors Bought Something)
This is a heck of a challenge for SQL, especially when we start asking it meaningful business questions. Remember, SQL can’t even BEGIN to do this until all the data is stored in one place – which by default, it certainly is NOT. But even if we allow that the EDW already has all of this, it’s still gonna be SLOW.
Check out this Power BI report:
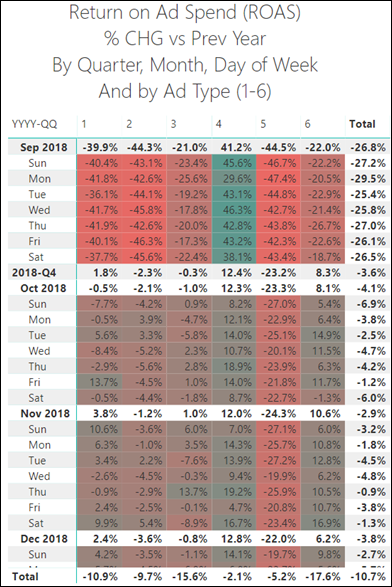
This. Is. Insane.
(Once you understand what it’s doing).
In human terms, Power BI is doing the following in order to show us this report:
- Find out how much we spent on each type of ad (1-6) – for each Quarter, each Year, each Month, AND each day of the week.
- Find out how much revenue we made – based on which type of Ad the customer originally clicked – again for all the same time “coordinates” (Quarter, Year, etc.)
- Divide the results of step 2 by step 1 – again for every single intersection of “coordinates,” both time and Ad type – to return a ratio known as ROAS.
- Now repeat the entire process – steps 1-3 – for the corresponding timeframe one year prior
- Subtract step 4 from step 3, then divide that difference by step 4
- Do all of this across many millions of rows – in different tables
- Display the MANY results – in a report that has has approximately 700 distinct final answers.
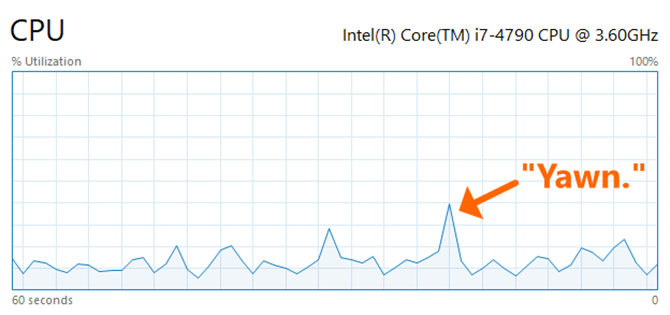
So… how long do you think the Power BI “brain” has to think on this? Do the lights flicker in the building while it runs? Can we go to lunch – or on vacation – while we wait for it to complete?
Nope. My computer was positively BORED by this challenge.
That’s… a sub-second spike of CPU – all the way up to the lofty heights of… 40% utilized.
(Yes, that’s all it took for Power BI to crunch and display steps 1-7 above across this hefty data set)
Even better: I did NOT need an EDW to do this! That’s right, I loaded the data from the three different systems directly into Power BI. No three year waiting period before getting started.
But assuming you HAVE an EDW, try running the queries (plural) that this will take you in SQL or similar languages. I’ll sit tight. Send me a telegram and tell me how long it took.
“Slow to Run” isn’t even the worst of the two Slow problems, however. No my friends – the queries are also Slow to Write.
SQL Queries are Slow to Write

Dr. Seuss Clearly Data Modeled
First of all, not everyone can write SQL statements. Yes, I know that Business Users do indeed sometimes learn SQL, but they have to be a special kind of proficient in order to pull off an equivalent to what I demonstrated above. And… even if a biz user IS that good at SQL, are you going to let them directly “ping” the EDW with their own handwritten queries? Probably not.
So, you have to hand this task off to a dedicated IT pro. Someone with the required skill and responsibility. These people do exist of course, because if you have the prerequisite EDW, well, someone had to build that thing, didn’t they? So there’s at least one such person lurking about.
They’re probably pretty busy, though. I mean, someone like that tends to be expensive and rare, and they usually have a LOT on their plate. So part of the “slow to write” is just “waiting for the right person to engage with you.”
And then you have the communication gap. The biz user needs to explain to the “SQL God” what it is that they need. This takes some time – emails, meetings, phone calls. And has a less than 50% chance of being accurate on the first go-round. And the SQL in question isn’t something the pro is gonna just rip through in five minutes.
It’s not uncommon for this process to stretch into WEEKS in the real world. That meets anyone’s definition of “slow.” In fact, one of our company’s single biggest historical consulting projects was to replace a multi-week SQL query-writing bottleneck with a data model, enabling the biz users to answer their own questions in minutes rather than waiting weeks. And guess who hired us to do the work? That’s right, the IT Director who was playing the role of “SQL God.” It was wearing HER out, too – and fortunately she was in a position to seek a better solution.
3) Power BI is NOT a Visualization Tool, and it’s NOT the New SSRS
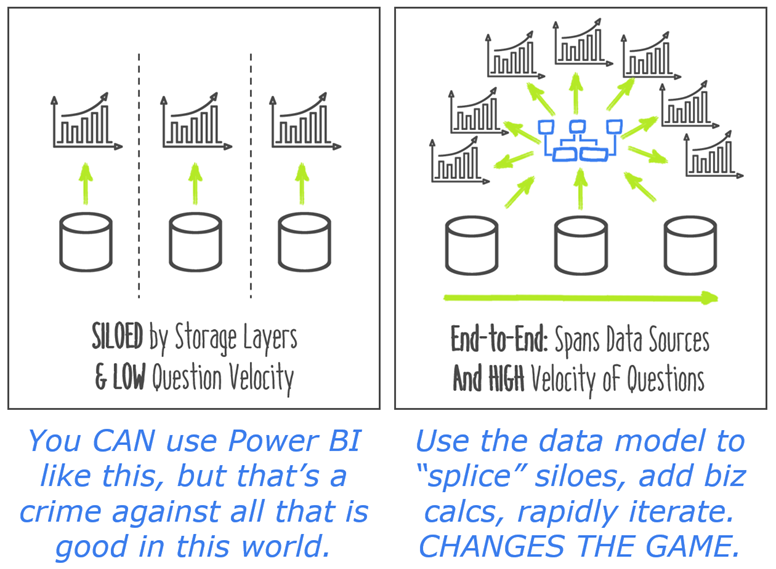
Back to the previously-teased topic… its time has finally come!
Sadly my friends, this is a common workflow we still see with Power BI:
- Launch Power BI
- Connect to a database, load a table of data
- Start making charts
No no no no NO. We didn’t come all the way through the 1980’s, 1990’s, and 2000’s to go right back to doing things the way we always did.
Anyone who describes Power BI as a VISUALIZATION tool is almost certainly following the workflow above, or expecting OTHERS to be using it that way.
And… anyone who describes Power BI as a REPORTING tool is almost certainly following the workflow above, or expecting OTHERS to be using it that way.
In that incomplete mindset, the workflow then progresses past step 3 and takes some really familiar turns…
- Launch Power BI
- Connect to a database, load a table of data
- Start making charts
- Immediately realize that you can’t make the charts you need to make
- Go looking for a table of data that DOES allow me to make the chart
- Fail to find such a table
- If I’m an IT type, I go make the required table (or view) in the storage layer – and I’ve fallen right back into the “storage as brain” trap of three decades ago.
- If I’m a biz user, I close Power BI and go looking for multiple reports that I can export to Excel
To be clear, steps 1-6 are CORRECT usage of Power BI! It’s just steps 7 and 8 that are the mistake.
Instead of steps 7-8, the RIGHT decision is to ENRICH THE DATA MODEL. Even if all you’ve done is load a single table, you already HAVE a data model. Power BI Desktop creates a blank data model when you first launch the app, and everything you load goes into said data model from the start. You just don’t have a particularly GOOD data model yet.
What does it mean to enrich the data model? Well, I’m glad you asked. At a high level, it entails a number of potential things, depending on the situation:
- Creating Measures – oh my goodness, this is SUCH a mind-blowing capability. It’s central and crucial to the entire story. When I want to assess how advanced a Power BI user is, the first thing I look for is measures – are they using them at all? (Often, no – it’s not like Power BI Desktop advertises in flashing neon “YOU SHOULD BE WRITING MEASURES.”). And if so, how sophisticated are the measures? This tells me nearly everything.
- Loading additional tables – like in my Power BI example above, where I’ve loaded Ad Display data, Website Visitor data, and eCommerce data – as SEPARATE tables! (As opposed to waiting around for someone to “make” me a table in SQL that somehow FrankenSplices the three into one grotesque, lumbering monster).
- Using relationships to link said tables together – in order for my multiple, separate tables to play a “symphony of data” with one another, yep, I’ve got to link them together. Which often requires additional tables (lookup, or dimension tables) that you normally wouldn’t think of.
It’s no accident that THIS is what our Power BI Foundations class is primarily about – those three things. Whether you’re taking our public workshop version, or we’re coming to your company to teach it privately, that’s the core focus of the agenda. Teach you the power of data models. Show you that Power BI is FAR more than a reporting and visualization tool.
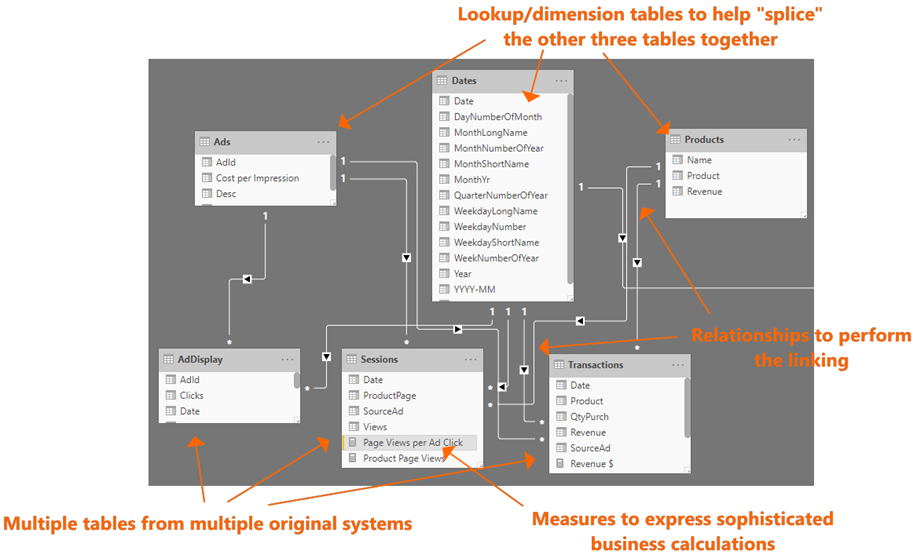
If You Haven’t Built Something that Looks Like This Yet, GOOD NEWS: Mind-Blowing Capabilities Still Await You!
So… Don’t Do it “Like That”
- If you hear someone trying to pigeonhole Power BI as “a viz tool,” or “just another reporting tool,” push back.
- If your Power BI data models don’t look somewhat similar to the above image, it’s time to dive deeper.
- If someone is saying that Tableau and Power BI are “clones,” ask them about Tableau’s data modeling capabilities (hint: Tableau fakes that it has a data model, but ultimately, it completely lacks an equivalent to Power BI’s data model, and is just a slightly-smarter version of the 1980’s dumb, storage-dependent tools).
- If you find yourself writing (or waiting on) tons of SQL to be written in order to give you what you need in Power BI, you might not have discovered data modeling yet.
- If IT is using Power BI to “pump out reports” like they did with SSRS, with no biz user intervention in the creation of the reports (AND the data models behind them), your org has not yet tapped into the cultural transformation that it needs in order to remain competitive. We can help you with that, btw.
Thanks for reading all of this, folks. Honestly I originally set out to write ONE article. Then split it into two when I saw just how lengthy it was going to be. And then STILL, I “cut” several topics from part two in order to keep THIS installment halfway-reasonable. So I’ve got a few more in the hopper that I’ll circle back to this summer
Microsoft’s platform is the world’s most fluid & powerful data toolset. Get the most out of it.
No one knows the Power BI ecosystem better than the folks who started the whole thing – us.
Let us guide your organization through the change required to become a data-oriented culture while squeezing every last drop* of value out of your Microsoft platform investment.
* – we reserve the right to substitute Olympic-sized swimming pools of value in place of “drops” at our discretion.
Get in touch with a P3 team member