
If You’re Not Building Data Models, You’re Not Doing Power BI (or Data!) the Right Way
Alternate Titles Abound!
I could have just as easily titled this post ANY of the following:
- Why Power BI is (much) better than Tableau and other tools
- Why Power BI is (much) better than SQL-based reporting
- The importance of Data Models
- How to Choose a Data Model?
- Power BI is not a “visualization tool”
- Visuals are for Show, Analysis is for Dough (credit to our good friend Pat Mahoney)
- Why the Big Data movement is missing something absolutely critical
So if any of those titles appeal to you more than the title at the top of the page, please feel free to mentally substitute it. I’ll wait.
Got the title swapped out in your head? Ok cool, let’s dive in… and as is often the case, a little bit of history will help. We need to know where we’ve BEEN, and WHY, to know where we should be GOING.
Everyone Understands the need for “Storage and Charts.”

Think About It: Almost EVERY Product or Service you See in the World of Data is Either Storage or Viz
(And that’s a shame. But spoiler alert: Power BI has a Brain.)
When you think about data, literally everyone understands that you have to:
- Store (and retrieve) said data
- Make charts (or reports) out of it
Those are, of course, the two most “face value” things in the world of data. Like… “duh, of COURSE, we need both of those.”
But BECAUSE those are the two most obvious things, the software world has forever catered to 99% JUST those two things. And because 99% of data software has traditionally fallen into one of those two buckets, all of the CUSTOMERS (you know, the entire WORLD) have followed suit.
To be fair, it’s hard to even CONCEIVE of something in the middle!
I adhered strictly to the “charts and storage” mindset for the first ten years of my career in data. Seriously, what else is there? OK, some calculations, fine, we need those from time to time. And some data cleansing. But I always thought of those two additional tasks as either being a storage-layer task (in SQL) or as “last mile” activities for visualization (i.e., stuff I’d do in Excel before producing charts). In fact, that’s worth calling out:

- The Biz thought of “calc and clean” as something tightly-tied to the visuals (primarily in Excel).
- IT thought of “calc and clean” as just another storage-layer task (primarily in SQL, but more recently, this thinking has infected “Big Data” too – more on this later).
So everything happened either at the visuals layer or the storage layer. IT and the Biz maybe differed on “what happens which place,” but neither of them thought about a brain in the middle.
Back to “storage,” and how SQL came to dominate IT-driven “analysis”
We already have/had a bajillion SQL pros in the world because we NEED storage and retrieval. And that’s great. The world RUNS on SQL, in a very real sense. But SQL, my friends, is NOT an analysis tool. It wasn’t designed for analysis, but it tries to PRETEND at analysis, and because it’s pretending… it’s terrible at it. (Much like Excel wasn’t designed for joining/splicing data sets, but then we retrofitted VLOOKUP into the mix, thus committing tens of millions of people to slave in the salt mines for decades – once you stray too far from the initial design purpose of a tool, you get something “barely adequate” AT BEST).
BUT… the popularity of SQL was sufficient. Despite its primitive analysis capabilities, SQL became the “de facto” analysis language of IT pros. Yeah, it wasn’t nearly as capable as some higher-end tools mysteriously referred to as “OLAP tools,” BUT… those mysterious other tools were difficult, expensive, and completely foreign. Why go to the hassle of all that when you’re already eyeballs-deep in SQL?

Our Story So Far: Our Storage and Retrieval Language (SQL) Also Evolved to… Pre-Process Data for Visualization
So at this point in the story, what was the IT world missing? Charts!
Enter… the “Brainless” Reporting Tools!
The software world said, “now that we have those “storage/calc/clean” problems licked, we need some charts over the top!” And thus began the Age of Reporting. Probably the two most commonly-known are Crystal Reports (now owned by SAP) and SSRS from Microsoft (the latter of which is pretty much the best-selling Microsoft “BI” product ever).
Despite their crushing popularity, reporting tools are NOT analysis tools! All they are/were, is an answer to the common question “I’ve got these SQL queries, how do I format the results and push them out to the masses?”

Reporting tools have NO BRAIN of their own! They are mindless robots displaying the results fed to them by SQL. And since SQL is poor at analysis, the world of reporting is ALSO poor at analysis.
For a SQL-skilled organization (like all IT departments), reporting tools offer a FAR TOO CONVENIENT way to “placate” the biz. “You need some data? Fine, we’ll write you a report. Charts? Oh, heck no, you can make those yourself. We’ll just format the SQL queries as tables and publish the output to the reporting portal, ok?” And the business agrees to this arrangement – what alternative IS there, really?
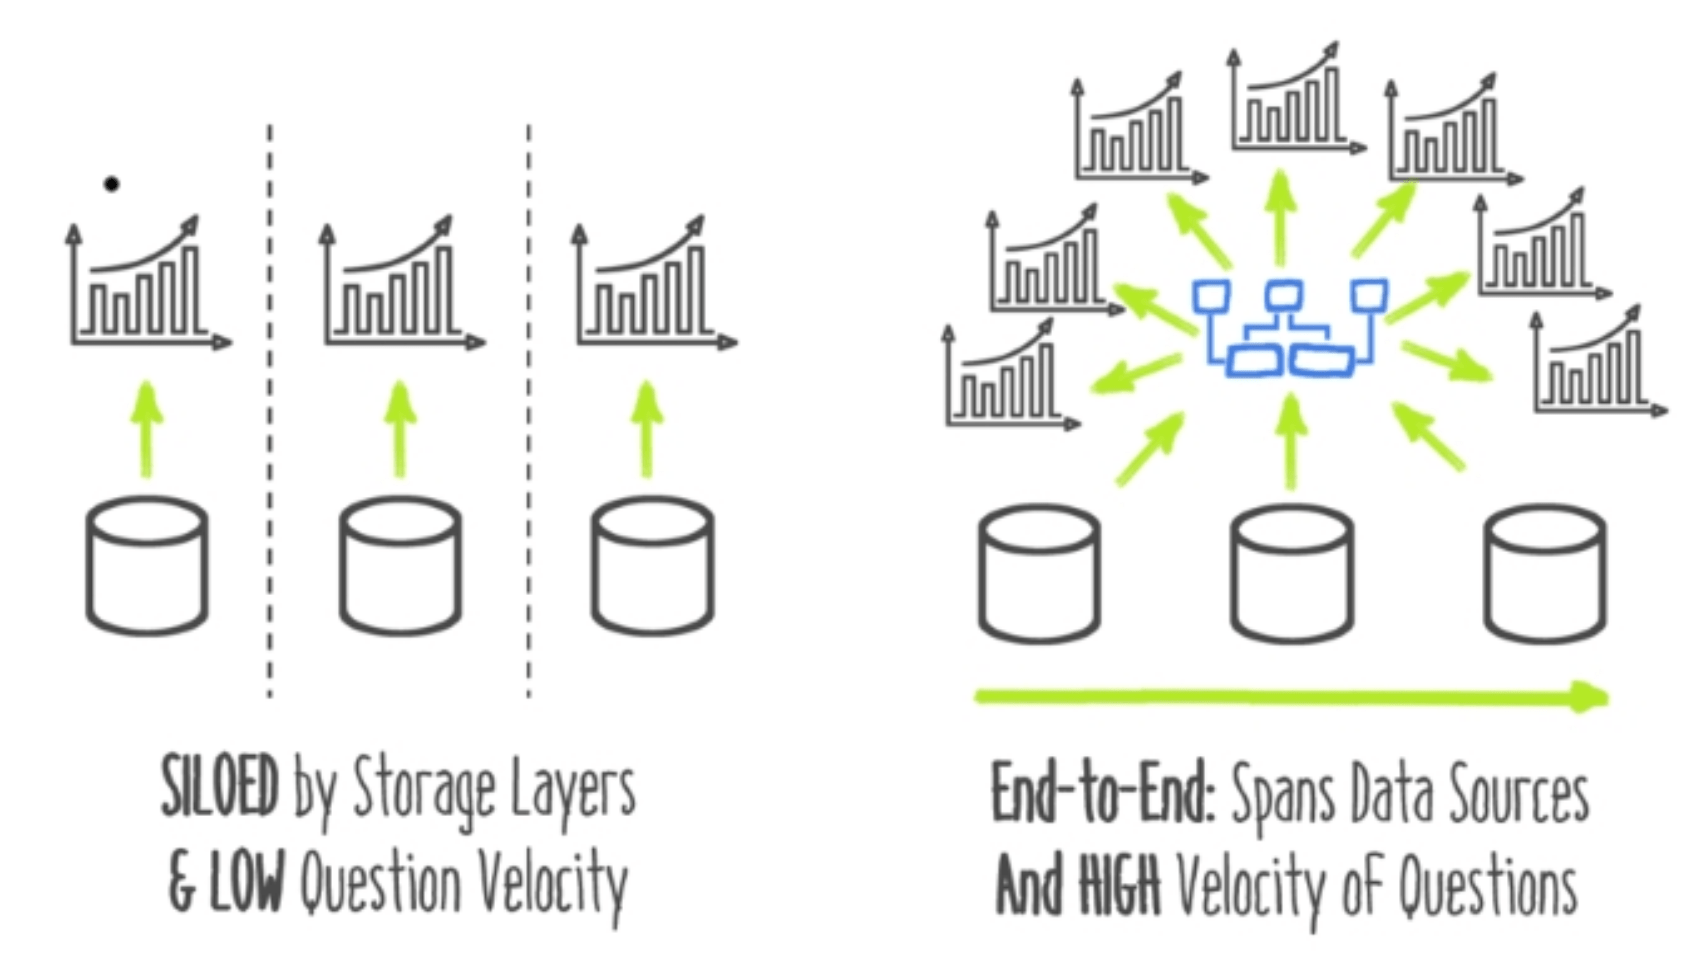
What’s Wrong With Brainless? Let’s start with “Siloed and Slow.”

You live with the consequences of brainless tools every day, so even without further explanation, I hope that the diagrams above are already starting to make sense. Either way, though, this article is running a bit long, so let’s hold the rest for Part Two.
Ready for Part Two? Read it Here!
Microsoft’s platform is the world’s most fluid & powerful data toolset. Get the most out of it.
No one knows the Power BI ecosystem better than the folks who started the whole thing – us.
Let us guide your organization through the change required to become a data-oriented culture while squeezing every last drop* of value out of your Microsoft platform investment.
* – we reserve the right to substitute Olympic-sized swimming pools of value in place of “drops” at our discretion.
Get in touch with a P3 team member