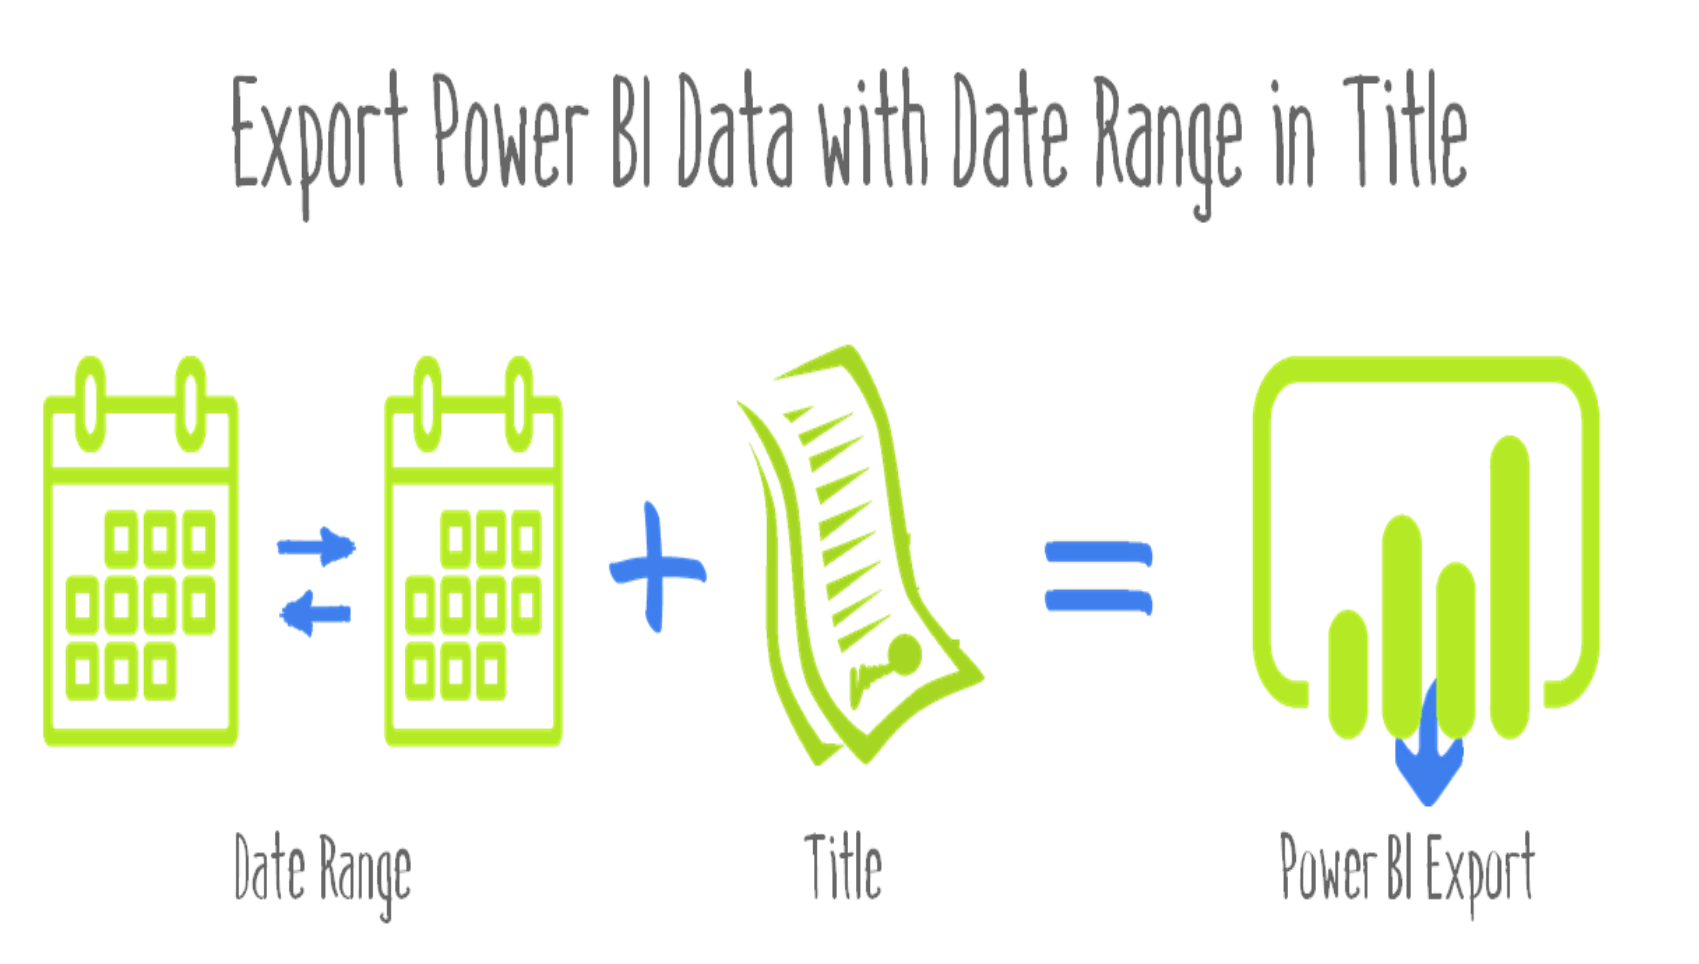
In Power BI, every visual needs a title. Titles not only makes it easier to manage items in the selection pane, but also provide context when exporting data. Without a title, info is exported with a generic title of “Data.” Not a great experience when report consumers go looking for specific exports. Conditional formatting for titles means that we can increase the meaning of titles by showing the filter context in the title and file names. Don’t want to show the title? Make the title invisible by setting the font color to match the background.
Here’s the documentation on conditional formatting for titles. Patrick in Guy in a Cube has a video showing it: Dynamic Titles in Power BI Desktop. And here’s Reid’s post on Using SELECTEDVALUES To Capture Power BI Slicer Selections, which can also be used to provide context to titles.
I’d like to share my [Date Grain] measure. It’s a text measure which returns significant date ranges. Date Grain can be combined with static text or other text measures to make a handier export title. For example, “Sales Report ” & [Date Grain], or “Budget vs Actual ” & [Date Grain].
Date Grain =
VAR StartDate =
    FIRSTDATE ( 'Date'[Date] )
VAR EndDate =
    LASTDATE ( 'Date'[Date] )
VAR OneDay =
    HASONEVALUE ( 'Date'[Date] )
VAR OneMonth =
    HASONEVALUE ( 'Date'[YYYYMM] )
        && StartDate = FIRSTDATE ( 'Date'[First Day Of Month] )
        && EndDate = LASTDATE ( 'Date'[Last Day Of Month] )
VAR OneYear =
    HASONEVALUE ( 'Date'[Year] )
        && StartDate = FIRSTDATE ( 'Date'[First Day Of Year] )
        && EndDate = LASTDATE ( 'Date'[Last Day Of Year] )
VAR MultipleYears =
    MONTH ( StartDate ) = 1
        && DAY ( StartDate ) = 1
        && MONTH ( EndDate ) = 12
        && DAY ( EndDate ) = 31
VAR StartYM = MIN ( 'Date'[YYYYMM] )
VAR EndYM =  MAX ( 'Date'[YYYYMM] )
VAR ContiguousDays =
    COUNTROWS (
        CALCULATETABLE ( 'Date',
            'Date'[YYYYMM] >= StartYM &&
            'Date'[YYYYMM] <= EndYM
         )
    )
VAR ActualDays = COUNTROWS ( 'Date' )
VAR MultipleMonths = ActualDays = ContiguousDays
RETURN
    FORMAT (
        SWITCH (
            TRUE (),
            OneDay, FORMAT ( StartDate, "yyyymmdd" ),
            OneMonth, FIRSTNONBLANK ( 'Date'[YYYYMM], 1 ),
            OneYear, FIRSTNONBLANK ( 'Date'[Year], 1 ),
            MultipleYears, MIN ( 'Date'[Year] ) & "-"
                & MAX ( 'Date'[Year] ),
            MultipleMonths, StartYM & "-" & EndYM
        ),
        ""
    )
The measure uses the diabolical pattern of SWITCH TRUE. And variables like OneMonth and MultipleYears have true/false values.
As you can see, I use a lot of variables to detect the date ranges. If a visual is filtered to one day, like 6/10/2019, the measure will show “20190610”. If a full month, like June of 2019, it shows “201906”. If one year, it would be “2019”. It can also do multiple years 2019-2025, or multiple months: 202011-202103.
Get in touch with a P3 team member