Wise Professionals See the Big Picture
Bringing it Home
Today we’ll be concluding our 3-part series on Analysis versus Reporting, Power BI versus SSRS and Paginated Reports, and looking closely at our habit of using the word “versus” so liberally:
- Part One summarized the history of the industry, its long-stagnant roots in Reporting, and the recent “triumph” of Analysis.
- Part Two examined the relative strengths of Power BI reports and Paginated (SSRS) Reports, and why you need both.
- Today, we’ll explore how you can use both Power BI and Paginated Reports together, as part of a wholistic system.
What Does “Triumph” Mean?
I’d like to start by clarifying what I mean when I say Analysis has “won.” Even today, traditional reporting is STILL the majority of the “biomass” in the BI world. For example, right now around the world, there are probably three people using a Traditional report for every one person using an Analytical one.
So Analysis isn’t dominating usage today, but it IS dominating mindshare. No one is BUYING platforms which are 100% traditional reporting – not anymore. And in fact, lots of people ARE buying pure Analysis platforms like Tableau. Of course, what they SHOULD be doing is buying platforms capable of BOTH, which is kinda the focus of today’s article.
Analysis Will Keep Stealing Usage Share for Awhile
So we have a ways to go before Analysis equals or eclipses Reporting in usage, but the wind has most definitely shifted. Keep in mind that a LARGE percentage of “usage” of Reporting is not “looking at it with our eyeballs” usage, but rather EXPORT usage, which powers ANALYTICAL work in Excel. Below the radar of IT and invisible, and crude compared to the Analysis you can perform in Power BI, but Analysis nonetheless.

Until the world stops using Reporting as a crude form of database access (to power its Excel analysis), the fight is not over. And we have a LONG ways to go to get there. Even today, a client told me a story about a team member who last week printed out a 30-page report and was planning to go line by line through it, re-keying a subset of the data into Excel (manually!) to get a total of how many units of Product X they’d sold in the prior month. Said individual was thrilled to be shown the Power BI report where a single click provided the answer. So we still have some work to do, awareness-wise.
Where Will We Land?
At most, I expect the inverse of today: three Analysis reports for every Traditional report. If we slowly convert the “Traditional reports which pretend to be informative but are really just export sources” into Analytical (Power BI) reports, that should get us there – and really, that’s ALL that we SHOULD do.
And if you read Part Two, you know there are certain kinds of reports that Power BI is “bad” at. We still need SOMETHING for those, and I expect they will still constitute, say, 25% of all reporting usage once we reach equilibrium.
Switching from “Or” to “And”
Part Two covered when to use X versus Y, but even a firm grasp of that leaves something important on the table: what are the ways you can use BOTH in an integrated manner, thus getting a result which is more than the sum of its parts? Ah yes, the “Better Together” cliché! But there is substance here.
Microsoft should be leaning HARD into this aspect of their platform – that it has STRONG products in both worlds, because so few of their competitors have anything to offer in the Traditional space, even as said competitors are already behind in the Analysis space. The combination of the two – when well-integrated, brings at least three very interesting classes of benefits:
- Cross-report drillthrough in either direction.
- Both kinds of reports in a single portal.
- Shared analytical model powering both flavors of reports.
Let’s take these one at a time.
Bi-Directional Drillthrough
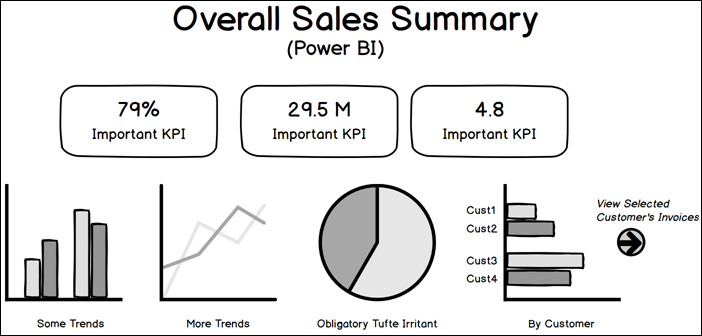
This is the most fun, so I’ll cover it first. Consider the following wireframe of a Power BI report:

We’re Going Wireframe Today – No Time for Distracting Myself with Hyper-realistic Demo Building
I hope it’s easy to imagine the interactive features of the above report. Click on a bar in one of the charts, for instance, and watch the rest of the report filter down to that Category or Customer, etc.
Imagine seeing Cust2 and thinking “hey, why is Customer 2 so low this month? Aren’t they normally buying a lot more from us? Let’s see what they actually bought – show me the invoices!” Well, here ya go…

Select Customer 2’s Bar, Click the Icon/Link
And then you get navigated to a Paginated Report to view the actual Invoices which were sent to Customer 2, because the filter selection you made in the Power BI report is “transmitted” as part of the URL:

Paginated Report Displays the Authentic Invoices
(The system “remembers” which customer you selected in Power BI – by passing it in the URL)
“Wait, Couldn’t I Build That Invoice Viewer in Power BI?”
Yeah, smart aleck, you COULD build precisely THAT one pictured above. But a couple things. One, a more realistic invoice might span multiple pages, with page breaks and intermediate subtotals, and Power BI isn’t good at that paginated stuff. Two, if you want to be absolutely sure you are looking at PRECISELY THE INVOICE which was sent, you would want to go to the source which generates and prints said invoices yes? And since said invoices often need to be pixel perfect, the original source again cannot be Power BI.
“Wait, How Do You Pass ‘Cust2’ in the URL?”
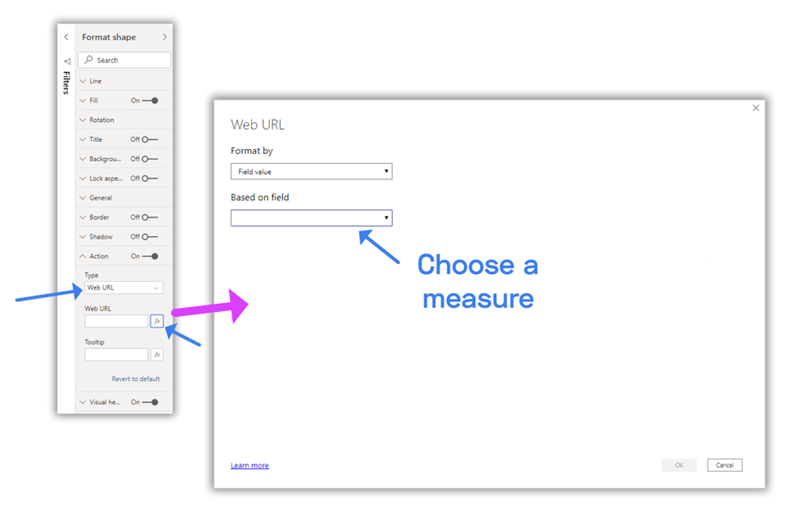
This isn’t a technical how-to article, and I’m trying to stay above the weeds, but here’s a quick series of screenshots which should help:
Format Shape –> Action –> Web URL –> fx –> Choose a Measure

Example of a Measure Which Constructs a URL to a Paginated Report
(Comes from a slightly more complex example than our wireframe demo)
And Now the Reverse Direction!
OK, so you’re looking at the invoice, and you spot the change. “They only bought ONE Flux Capacitor this month! Don’t they normally buy more??”
Aha! Well NOW you’re back to an Analysis kind of task! You COULD thumb backwards through invoices using the “Prev Invoice” link, but if the invoices are multi-page, that’s gonna be tedious, AND it’s hard to spot trends that way. Power BI is REALLY good at this kind of thing.
If only there were a way to seamlessly navigate to a Power BI report, pre-filtered to answering my question…

Ooh! It’s a Link!

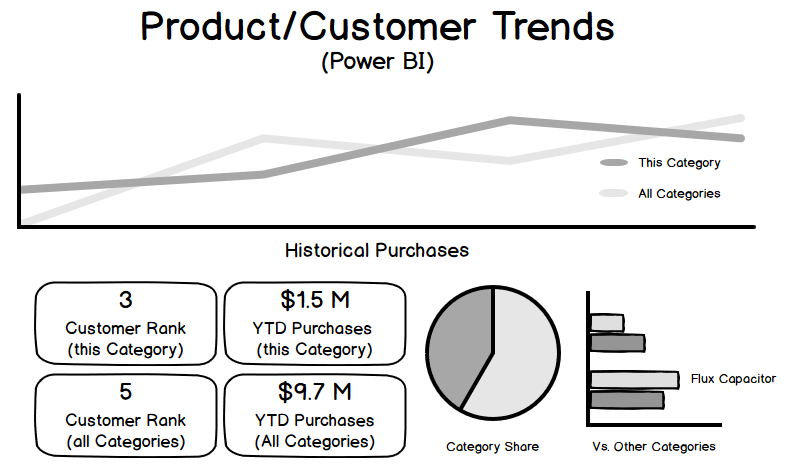
Navigated back from Paginated to Power BI, With Product Category=”Flux Capacitor” and Customer=”Cust2”
(A different Power BI report than the one we started on, but of course depending on actual needs, it COULD have been the original)
“OK, Spill It – How’d You Do the URL THIS Time?”
Shockingly similar on the Paginated side (in Report Builder) to the Power BI side, actually…

In Report Builder, Select Text Box Properties

“Go to URL”

Build Yourself an Expression
(Again though I’m taking a pass on the weedy details today – trying to keep it as concise as we can around here)
Pretty Neat Huh?
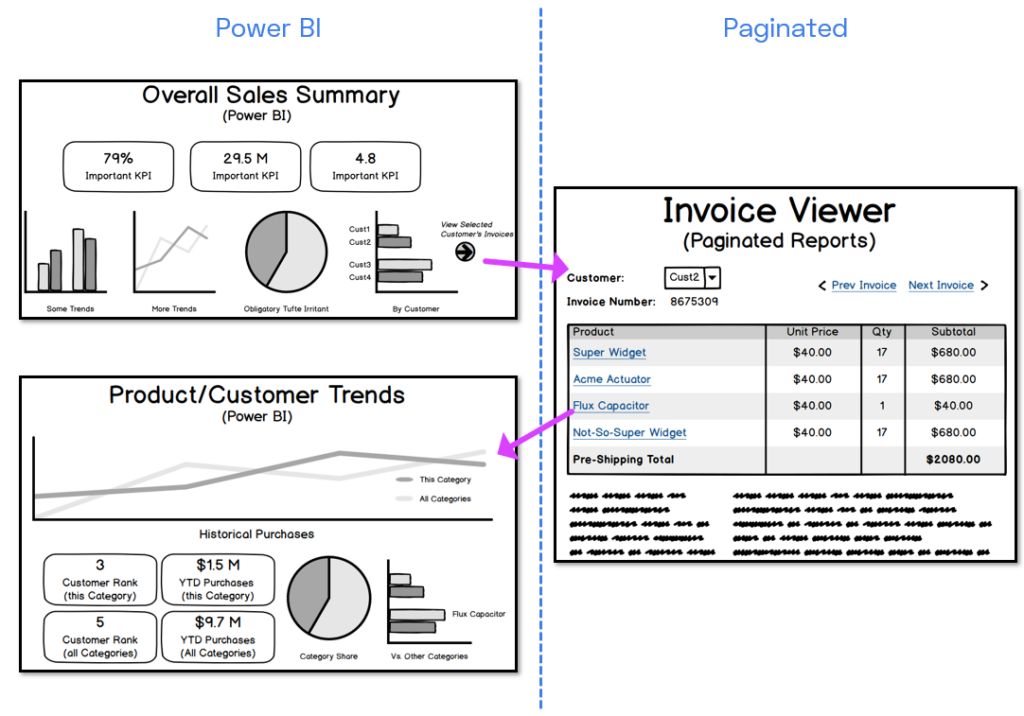
Let’s see that whole flow one more time, in a more concise manner:

Glorious: You Bounce Back and Forth Across “the Line of Versus” with Agility
***BONUS THOUGHT: As cool as that is, I wonder if even TIGHTER integration makes sense in some cases. The custom visual framework in Power BI, in theory, could support an embedded Paginated Report control right? Would there be use cases for that? Or would the clarity of being in a completely separate report always be preferable? I’d bet that it would at least be interesting in SOME cases, but I need to think about it more. Leave a comment if you have an opinion, please!
Benefit Two: Single Portal
Not as sexy as cross-technology drillthrough, but a real benefit for everyone’s sanity as well as usage: both kinds of reports can be published to a single Workspace:

OMG, BOTH TYPES of Reports in the Same Workspace? THAT’S PETER VENKMAN’S MUSIC!

Back off, man. I’m a data scientist.
Don’t sleep on the little details like this. They make a big difference.
Benefit Three: Powered by the Same Analytical Model
SSAS Tabular (Power BI’s analytical engine) brings MANY advancements relative to its predecessor (SSAS MD), and one of them is the ability to return hyper-detailed rowsets without the performance penalty we suffered in the old days. If you want the data to populate an Invoice, you can fetch what you need with a DAX query and not sit there waiting forever for it to return. In fact, things like the Table visual already do this within Power BI itself.
So if you’ve invested in a robust Power BI analytical model to power your analysis, you might find yourself reaping unexpected Paginated Reporting benefits. If you don’t NEED to go build new, traditional SQL-powered plumbing to power a more traditional report, great! By all means, connect it to your Power BI model (aka Dataset), and off you go!

Your Data Model Can Power BOTH Kinds of Reports
And folks, that wraps up our series! What did you think? Did I leave anything out? Wait, what’s that you say? There IS something I missed? Lemme see…
“Hey Rob, How About a Good Microsoft Rant?”
How about more than one? I mean, I’m so glad you asked, cuz I’ve got two…
Integration Shouldn’t Cost So Much
First, why is it so expensive to get an integrated environment? Best I can tell, you can’t get a Power BI + Paginated integrated system for anything close to the price of getting them separately. 100 users of Power BI Pro would cost $1k a month, and an SSRS On-Prem server is a one-time payment of, say, $6500. So to run those two – separately – for two years, it would cost you about $30k all-in.
But to get them integrated, today you’d have to plunk down $5k a month for Premium, and that pushes your 2-year price to $120k – 4x having the same capabilities separately. Now, I’m pretty sure I can get benefits 1 and 3 (drillthrough and powering both from a shared data model) at the $30k two-year price, so what the extra $90k gets me is… benefit two? Side-by-side publishing of both report types in a single Workspace? Steep price jump for just that.
On the on-prem front, you can go Power BI Report Server, but that’s also a premium price point. Enterprise Edition plus Software Assurance is required, apparently, and that’s 100% an Enterprise SKU – well out of the reach of SMB’s, and just as importantly… out of Departmental reach within the Enterprise itself.
In fairness to Microsoft, the pricing for Enterprise customers DOES need to drive their thinking in large part. And that comes with benefits! Most of Microsoft’s data stack is actually quite underpriced for SMB’s and Departments, and we never complain about THAT, do we? At P3 Adaptive for instance we can run all of our MS data stuff for a FRACTION of what we pay for Salesforce (which we deeply regret getting hooked into, but that’s a story for another day isn’t it)? There’s a lot more value in the MS platform than Salesforce, and yet the prices are reversed.
So this may be a sensible pricing strategy for the Enterprise, but this is one of those cases where it prohibits SMB’s (and again, the Departmental level of the Enterprise, which is crucial for “land and expand”) from playing the game properly.
It’s a massive strength for the MS platform versus the competition, and it seems a shame that Departmental/SMB is accidentally priced out of the most elegant version today.
OMG Naming!

Authentic Action Photo of Microsoft Naming Their Software
Oh, “Paginated Reports,” how I LOATHE thee as a name! This name caused me SO MUCH TROUBLE for a very long time. “How does this relate to SSRS?” is the question which kept plaguing me. Is it a new thing? If someone knows SSRS really well, will this be a foreign experience – a brand new technology – or super familiar? Is it not capable of pixel perfect document generation, and instead ONLY leans into the truly Paginated benefits of SSRS? Ugh.
Here’s what it REALLY is: it’s SSRS technology living within the Power BI environment. You still get Report Builder, and the whole thing still uses RDL. If you knew SSRS, Paginated Reports are for you. Which is good news – SSRS was, and is, a market leader in its space. Super robust and capable. Refined by TWO DECADES of development and experience.
Now, again, I kinda DO get why they’re doing this. Power BI is “the brand” now, and everything needs to line up under that banner. Years from now, this naming scheme will be a good one. “Power BI just has two kinds of reports, great!” But I think they underestimate the utter carnage this wreaks in the meantime, and how many times we’re going to have to explain to people that “it’s just SSRS in Power BI.”
Remember, I’m the guy who tried to rename PivotTables when I worked on Excel at Microsoft. So I’m definitely cut from the same cloth originally – I’m just trying to heal, and to atone for my past sins. But “yeah,” said Rob circa 2004, “PivotTable is such a wacky and scary name which has nothing to do with its primary function, which is to summarize/aggregate data.” I wanted to rename it SummaryTable. Just like I explained above, if you fast forward ten years, that’s a better name. Zero question. But is it worth the transition cost? In the end, wiser heads talked me out of it.
While we’re at it… can we rename Power Pivot and Power Query to be… Power BI in Excel? Because just like we’re explaining Paginated Reports = SSRS in Power BI, we have to explain the Excel relationship over and over and over…
Nah, too sensible.
Get in touch with a P3 team member
