Welcome back P3 Adaptive Nation for Part 2 of our Power Query (M)agic series! Today I’ll be addressing an issue many of us have experienced, what to do with the LAUNDRY LIST of PQ queries you have. Since it feels really awkward to say Power Query Queries…for the rest of this post they will be simply called queries, keeping it simple folks! Any respectable data model often ends up with a plethora of queries. The more queries you have, the harder it is to navigate or find the one you want. This is where today’s solution comes in!
Technique #2 – Queries Are Like Documents In A File Cabinet
How do you organize documents? You put them in FOLDERS! If you’ve ever used Power Query to pull data into a data model in Excel or Power BI, then you know how many different queries it can have. The most I’ve had in a model I’ve designed is 78, crazy right… So it’s easy to imagine how a list of queries that long can get really complex, especially when you’re trying to find one to edit.
In PQ, Organizing Your Queries Is All About Making GROUPS!
A great (and easy) way that Power Query solves this issue is a feature that lets you add folders and even sub-folders. It’s a great way to organize and group your queries anyway you’d like. I’ll show you how to create these groups first, then I’ll explain the groups I typically like to make.
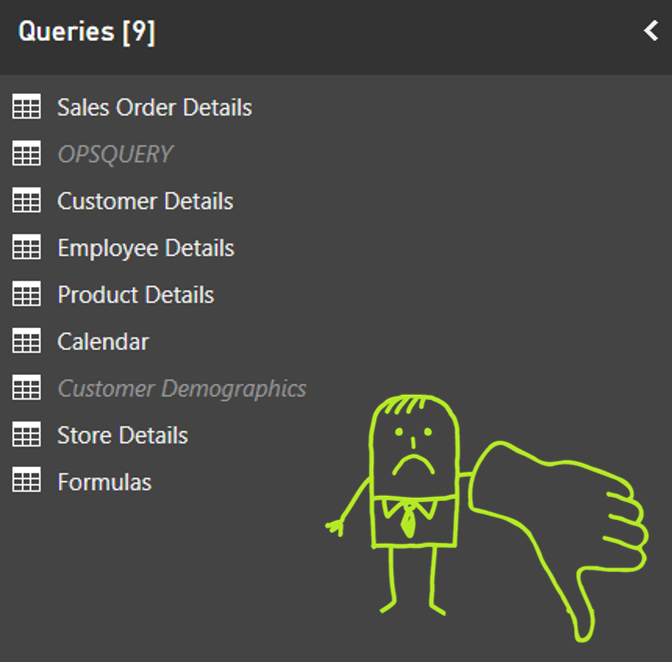
Giant hand man doesn’t like this uncategorized mess:

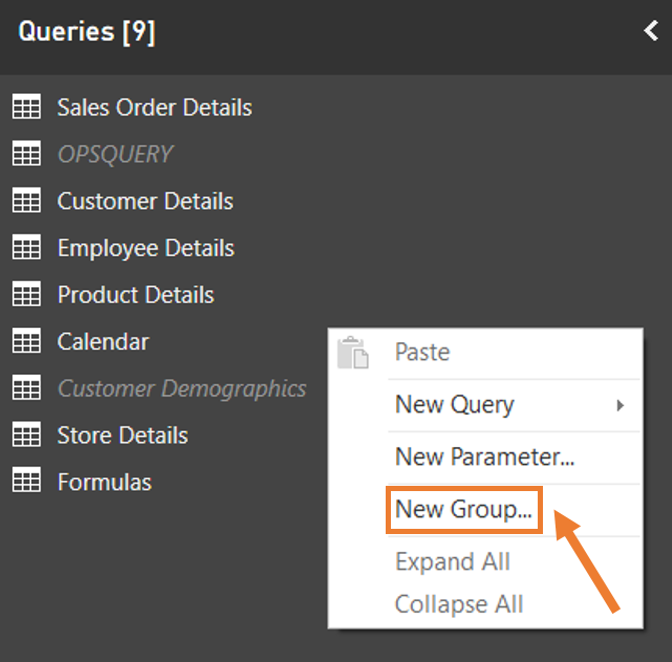
STEP 1 – Right click anywhere in the Queries section and select New Group:

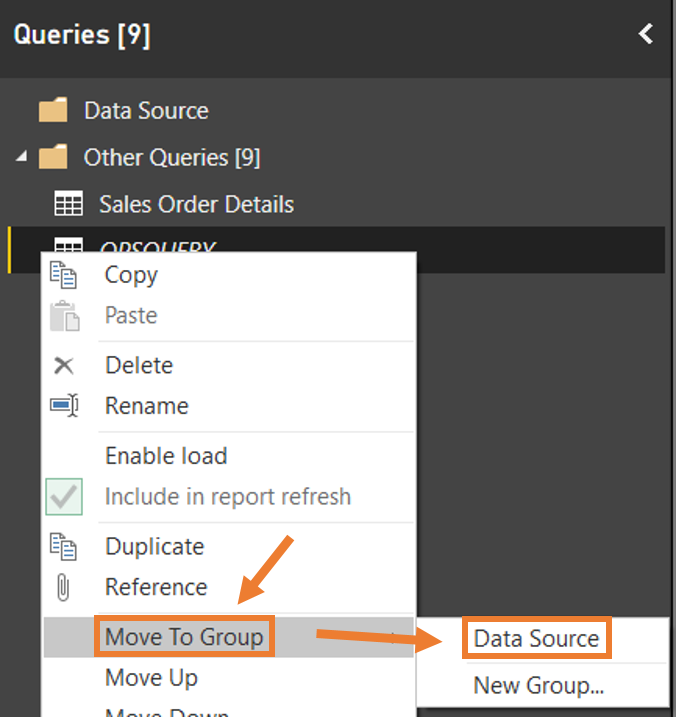
STEP 2 – Right click on any query and select Move to Group:

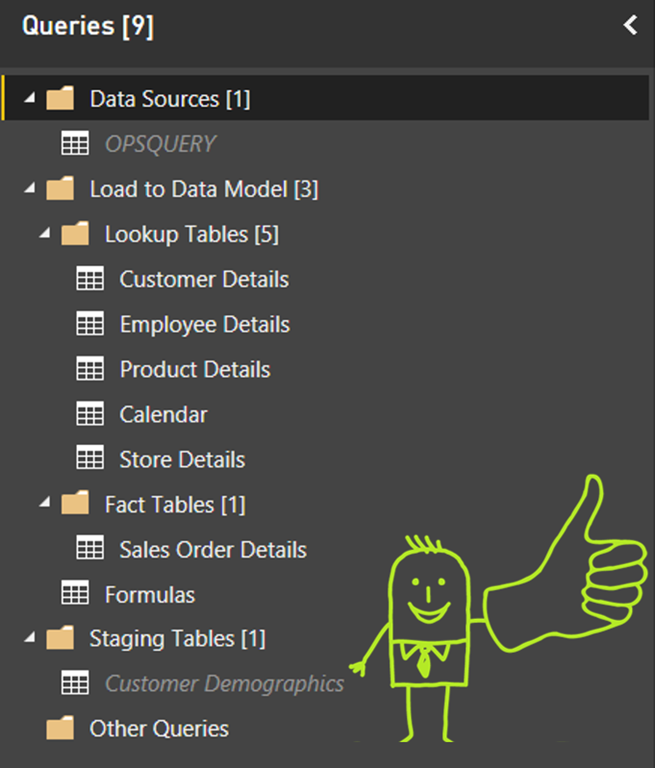
End Result Folder Organization…giant hand man approves this technique!

Some of you may have noticed the groupings I created. Arguably there’s no “best” technique when it comes to organizing your queries, but I find this one very straight forward. I like to group my queries into three main categories.
- E – Data Sources
- T – Staging Tables
- L – Load to Data Model
Think of these as checkpoints along a journey, starting from where the data is coming from…and ending in the data model.
Umm, ETL? What is that? ELI5 please!
Some of you know what those fancy “E.T.L.” letters mean. Cheers to you guys – you’ve scored in the top quartile of nerd! If you don’t know what those letters mean, then here’s a quick overview. If you find your self writing TLDR often then here’s the short version. Your data lives somewhere, you have to go get it, clean it up a bit, and put it in your data model. That’s ETL! That’s exactly what Power Query is designed to do! Here’s the longer version …
Extract Your Data
Our journey starts with gathering up our data. The data source is the place where I store ALL connections to the data sources, with each getting their own unique query. Remember that beautiful feature I showcased in Power Query (M)agic Part 1: Always Have Good References? Well those reference queries go here, enough said.
Transform Your Data
In the middle of our journey area the Staging Tables. They can also be called Transformation Tables or Mapping Tables, pick the terminology (dealers choice). These are where I put any tables that are used for transformations, joins, filters, etc… but aren’t actually LOADED into the Data Model. So to reiterate…transformations, custom mappings, and other miscellaneous COOL STUFF goes here. Some models might have lots of these, many models don’t have have any. Got it? Good, moving on.
Load Your Data
The destination of our wonderful journey! All roads lead to the data model. Simply put, if the query is being loaded as a table into the data model, it goes into the Load to Data Model group. You’ll notice that I have two sub-folders within this group as well, Lookup Tables and Fact Tables. Lookup Tables (Dimension Tables for the SQL-minded) are tables that are typically semi-static or infrequently updated (E.g. Customers, Employees, Calendars, etc…). Fact Tables (we also call them Data Tables!) are where the bulk of the data is kept and they usually grow or get updated frequently (E.g. orders, data recordings, time tracking, etc…).
More information about data modeling concepts can be found in another great post written by Rob called Data Modeling in Power Pivot and PBI. Alright that’s it for today’s post folks, hopefully this added a tool to your belt. So until next time folks!
Interested in Learning How to Do this Kind of Thing?

Our New Online Power Query Course just launched this year. You’ll learn Power Query from the best in the business, two Excel MVPs Ken Puls and Miguel Escobar. We’ve included 7 Hours of Self-Paced Video over 31 Courses, with lots of example files, and a Digital Badge powered by Acclaim.
CLICK HERE to claim your spot.
Get in touch with a P3 team member